


Across the recent three months, 21 analysts have shared their insights on Visa V, expressing a variety of opinions spanning from bullish to bearish.
Summarizing their recent assessments, the table below illustrates the evolving sentiments in the past 30 days and compares them to the preceding months.
| Bullish | Somewhat Bullish | Indifferent | Somewhat Bearish | Bearish | |
|---|---|---|---|---|---|
| Total Ratings | 4 | 13 | 4 | 0 | 0 |
| Last 30D | 0 | 0 | 1 | 0 | 0 |
| 1M Ago | 0 | 0 | 0 | 0 | 0 |
| 2M Ago | 0 | 1 | 0 | 0 | 0 |
| 3M Ago | 4 | 12 | 3 | 0 | 0 |
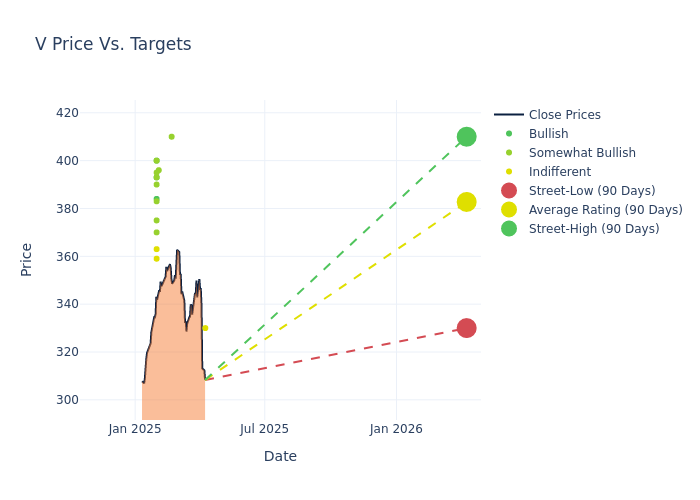
The 12-month price targets, analyzed by analysts, offer insights with an average target of $377.33, a high estimate of $410.00, and a low estimate of $330.00. This current average has increased by 8.1% from the previous average price target of $349.05.
Exploring Analyst Ratings: An In-Depth Overview
A comprehensive examination of how financial experts perceive Visa is derived from recent analyst actions. The following is a detailed summary of key analysts, their recent evaluations, and adjustments to ratings and price targets.
| Analyst | Analyst Firm | Action Taken | Rating |Current Price Target| Prior Price Target | |--------------------|-----------------------|---------------|---------------|--------------------|--------------------| |Adam Frisch |Evercore ISI Group |Announces |In-Line | $330.00|- | |James Friedman |Susquehanna |Raises |Positive | $410.00|$395.00 | |Ramsey El-Assal |Barclays |Raises |Overweight | $396.00|$361.00 | |Rufus Hone |BMO Capital |Raises |Outperform | $370.00|$350.00 | |Dan Dolev |Mizuho |Raises |Neutral | $359.00|$304.00 | |Arvind Ramnani |Piper Sandler |Raises |Overweight | $383.00|$368.00 | |Andrew Schmidt |Citigroup |Raises |Buy | $393.00|$354.00 | |Rayna Kumar |UBS |Raises |Buy | $400.00|$350.00 | |Tien-Tsin Huang |JP Morgan |Raises |Overweight | $375.00|$340.00 | |Matthew O'Neill |Goldman Sachs |Raises |Buy | $384.00|$346.00 | |Rayna Kumar |Oppenheimer |Raises |Outperform | $390.00|$375.00 | |Sanjay Sakhrani |Keefe, Bruyette & Woods|Raises |Outperform | $400.00|$360.00 | |John Davis |Raymond James |Raises |Outperform | $393.00|$374.00 | |Donald Fandetti |Wells Fargo |Raises |Overweight | $395.00|$360.00 | |James Friedman |Susquehanna |Raises |Positive | $395.00|$375.00 | |Jason Kupferberg |B of A Securities |Raises |Neutral | $363.00|$331.00 | |John Davis |Raymond James |Raises |Outperform | $374.00|$329.00 | |Arvind Ramnani |Piper Sandler |Raises |Overweight | $368.00|$322.00 | |Jason Kupferberg |B of A Securities |Raises |Neutral | $331.00|$314.00 | |Raimo Lenschow |Barclays |Raises |Overweight | $361.00|$347.00 | |Andrew Schmidt |Citigroup |Raises |Buy | $354.00|$326.00 |
Key Insights:
- Action Taken: Analysts adapt their recommendations to changing market conditions and company performance. Whether they 'Maintain', 'Raise' or 'Lower' their stance, it reflects their response to recent developments related to Visa. This information provides a snapshot of how analysts perceive the current state of the company.
- Rating: Analysts unravel qualitative evaluations for stocks, ranging from 'Outperform' to 'Underperform'. These ratings offer insights into expectations for the relative performance of Visa compared to the broader market.
- Price Targets: Analysts gauge the dynamics of price targets, providing estimates for the future value of Visa's stock. This comparison reveals trends in analysts' expectations over time.
Navigating through these analyst evaluations alongside other financial indicators can contribute to a holistic understanding of Visa's market standing. Stay informed and make data-driven decisions with our Ratings Table.
Stay up to date on Visa analyst ratings.
Unveiling the Story Behind Visa
Visa is the largest payment processor in the world. In fiscal 2023, it processed almost $15 trillion in total volume. Visa operates in over 200 countries and processes transactions in over 160 currencies. Its systems are capable of processing over 65,000 transactions per second.
Visa's Financial Performance
Market Capitalization: Boasting an elevated market capitalization, the company surpasses industry averages. This signals substantial size and strong market recognition.
Positive Revenue Trend: Examining Visa's financials over 3M reveals a positive narrative. The company achieved a noteworthy revenue growth rate of 10.15% as of 31 December, 2024, showcasing a substantial increase in top-line earnings. In comparison to its industry peers, the company trails behind with a growth rate lower than the average among peers in the Financials sector.
Net Margin: Visa's net margin excels beyond industry benchmarks, reaching 53.83%. This signifies efficient cost management and strong financial health.
Return on Equity (ROE): Visa's ROE excels beyond industry benchmarks, reaching 13.56%. This signifies robust financial management and efficient use of shareholder equity capital.
Return on Assets (ROA): The company's ROA is a standout performer, exceeding industry averages. With an impressive ROA of 5.49%, the company showcases effective utilization of assets.
Debt Management: Visa's debt-to-equity ratio is below industry norms, indicating a sound financial structure with a ratio of 0.55.
Analyst Ratings: Simplified
Within the domain of banking and financial systems, analysts specialize in reporting for specific stocks or defined sectors. Their work involves attending company conference calls and meetings, researching company financial statements, and communicating with insiders to publish "analyst ratings" for stocks. Analysts typically assess and rate each stock once per quarter.
Analysts may enhance their evaluations by incorporating forecasts for metrics like growth estimates, earnings, and revenue, delivering additional guidance to investors. It is vital to acknowledge that, although experts in stocks and sectors, analysts are human and express their opinions when providing insights.
Which Stocks Are Analysts Recommending Now?
Benzinga Edge gives you instant access to all major analyst upgrades, downgrades, and price targets. Sort by accuracy, upside potential, and more. Click here to stay ahead of the market.
This article was generated by Benzinga's automated content engine and reviewed by an editor.
Edge Rankings
Price Trend
© 2025 Benzinga.com. Benzinga does not provide investment advice. All rights reserved.
date | ticker | name | Price Target | Upside/Downside | Recommendation | Firm |
|---|
Trade confidently with insights and alerts from analyst ratings, free reports and breaking news that affects the stocks you care about.

