


In the last three months, 4 analysts have published ratings on Fortrea Holdings FTRE, offering a diverse range of perspectives from bullish to bearish.
The following table provides a quick overview of their recent ratings, highlighting the changing sentiments over the past 30 days and comparing them to the preceding months.
| Bullish | Somewhat Bullish | Indifferent | Somewhat Bearish | Bearish | |
|---|---|---|---|---|---|
| Total Ratings | 0 | 0 | 4 | 0 | 0 |
| Last 30D | 0 | 0 | 1 | 0 | 0 |
| 1M Ago | 0 | 0 | 0 | 0 | 0 |
| 2M Ago | 0 | 0 | 3 | 0 | 0 |
| 3M Ago | 0 | 0 | 0 | 0 | 0 |
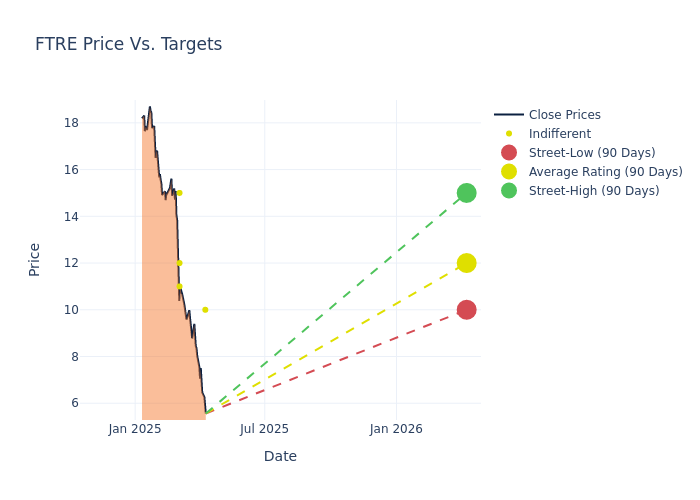
Analysts have recently evaluated Fortrea Holdings and provided 12-month price targets. The average target is $12.0, accompanied by a high estimate of $15.00 and a low estimate of $10.00. Experiencing a 39.24% decline, the current average is now lower than the previous average price target of $19.75.
Deciphering Analyst Ratings: An In-Depth Analysis
The perception of Fortrea Holdings by financial experts is analyzed through recent analyst actions. The following summary presents key analysts, their recent evaluations, and adjustments to ratings and price targets.
| Analyst | Analyst Firm | Action Taken | Rating |Current Price Target| Prior Price Target | |--------------------|--------------------|---------------|---------------|--------------------|--------------------| |Ann Hynes |Mizuho |Lowers |Neutral | $10.00|$12.00 | |Elizabeth Anderson |Evercore ISI Group |Lowers |In-Line | $15.00|$20.00 | |Matthew Sykes |Goldman Sachs |Lowers |Neutral | $11.00|$22.00 | |Luke Sergott |Barclays |Lowers |Equal-Weight | $12.00|$25.00 |
Key Insights:
- Action Taken: Responding to changing market dynamics and company performance, analysts update their recommendations. Whether they 'Maintain', 'Raise', or 'Lower' their stance, it signifies their response to recent developments related to Fortrea Holdings. This offers insight into analysts' perspectives on the current state of the company.
- Rating: Offering a comprehensive view, analysts assess stocks qualitatively, spanning from 'Outperform' to 'Underperform'. These ratings convey expectations for the relative performance of Fortrea Holdings compared to the broader market.
- Price Targets: Analysts explore the dynamics of price targets, providing estimates for the future value of Fortrea Holdings's stock. This examination reveals shifts in analysts' expectations over time.
To gain a panoramic view of Fortrea Holdings's market performance, explore these analyst evaluations alongside essential financial indicators. Stay informed and make judicious decisions using our Ratings Table.
Stay up to date on Fortrea Holdings analyst ratings.
If you are interested in following small-cap stock news and performance you can start by tracking it here.
About Fortrea Holdings
Fortrea Holdings is a late-stage contract research organization, or CRO, that provides comprehensive Phase I through IV clinical trial management, clinical pharmacology, and patient access solutions. The company works with emerging and large biopharma, medical device, and diagnostic companies to run their clinical trials as a functional-service provider, full-service provider, and offers hybrid trials. In 2023, Fortrea was formed as an independent, publicly traded company after Labcorp spun off its clinical development business, which it acquired via its purchase of Covance in 2015 for $6.1 billion. Fortrea has 19,000 staff members across 90 countries.
Financial Insights: Fortrea Holdings
Market Capitalization Perspectives: The company's market capitalization falls below industry averages, signaling a relatively smaller size compared to peers. This positioning may be influenced by factors such as perceived growth potential or operational scale.
Revenue Challenges: Fortrea Holdings's revenue growth over 3M faced difficulties. As of 31 December, 2024, the company experienced a decline of approximately -1.79%. This indicates a decrease in top-line earnings. When compared to others in the Health Care sector, the company faces challenges, achieving a growth rate lower than the average among peers.
Net Margin: The company's net margin is a standout performer, exceeding industry averages. With an impressive net margin of -8.78%, the company showcases strong profitability and effective cost control.
Return on Equity (ROE): Fortrea Holdings's financial strength is reflected in its exceptional ROE, which exceeds industry averages. With a remarkable ROE of -4.26%, the company showcases efficient use of equity capital and strong financial health.
Return on Assets (ROA): Fortrea Holdings's ROA surpasses industry standards, highlighting the company's exceptional financial performance. With an impressive -1.69% ROA, the company effectively utilizes its assets for optimal returns.
Debt Management: Fortrea Holdings's debt-to-equity ratio is below the industry average at 0.88, reflecting a lower dependency on debt financing and a more conservative financial approach.
How Are Analyst Ratings Determined?
Benzinga tracks 150 analyst firms and reports on their stock expectations. Analysts typically arrive at their conclusions by predicting how much money a company will make in the future, usually the upcoming five years, and how risky or predictable that company's revenue streams are.
Analysts attend company conference calls and meetings, research company financial statements, and communicate with insiders to publish their ratings on stocks. Analysts typically rate each stock once per quarter or whenever the company has a major update.
Analysts may supplement their ratings with predictions for metrics like growth estimates, earnings, and revenue, offering investors a more comprehensive outlook. However, investors should be mindful that analysts, like any human, can have subjective perspectives influencing their forecasts.
Breaking: Wall Street's Next Big Mover
Benzinga's #1 analyst just identified a stock poised for explosive growth. This under-the-radar company could surge 200%+ as major market shifts unfold. Click here for urgent details.
This article was generated by Benzinga's automated content engine and reviewed by an editor.
Edge Rankings
Price Trend
© 2025 Benzinga.com. Benzinga does not provide investment advice. All rights reserved.
date | ticker | name | Price Target | Upside/Downside | Recommendation | Firm |
|---|
Trade confidently with insights and alerts from analyst ratings, free reports and breaking news that affects the stocks you care about.

