


In the last three months, 10 analysts have published ratings on Arch Capital Group ACGL, offering a diverse range of perspectives from bullish to bearish.
The table below provides a concise overview of recent ratings by analysts, offering insights into the changing sentiments over the past 30 days and drawing comparisons with the preceding months for a holistic perspective.
| Bullish | Somewhat Bullish | Indifferent | Somewhat Bearish | Bearish | |
|---|---|---|---|---|---|
| Total Ratings | 2 | 7 | 1 | 0 | 0 |
| Last 30D | 1 | 0 | 0 | 0 | 0 |
| 1M Ago | 0 | 0 | 1 | 0 | 0 |
| 2M Ago | 1 | 5 | 0 | 0 | 0 |
| 3M Ago | 0 | 2 | 0 | 0 | 0 |
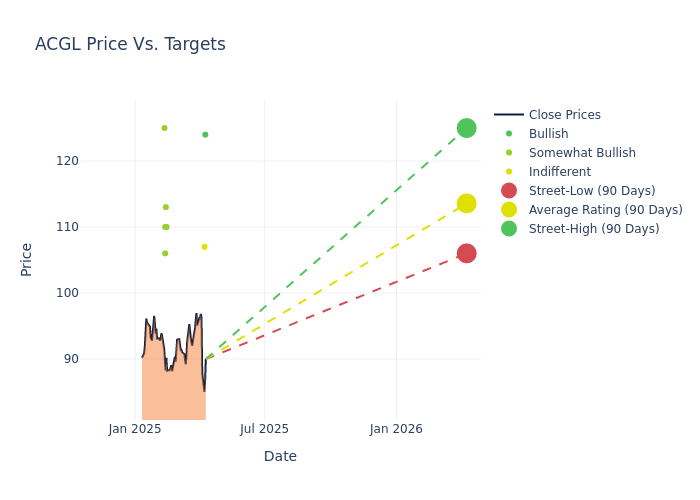
The 12-month price targets, analyzed by analysts, offer insights with an average target of $114.9, a high estimate of $127.00, and a low estimate of $106.00. Experiencing a 3.12% decline, the current average is now lower than the previous average price target of $118.60.
Interpreting Analyst Ratings: A Closer Look
The standing of Arch Capital Group among financial experts becomes clear with a thorough analysis of recent analyst actions. The summary below outlines key analysts, their recent evaluations, and adjustments to ratings and price targets.
| Analyst | Analyst Firm | Action Taken | Rating |Current Price Target| Prior Price Target | |--------------------|-----------------------|---------------|-----------------|--------------------|--------------------| |Brian Meredith |UBS |Lowers |Buy | $124.00|$127.00 | |Jimmy Bhullar |JP Morgan |Raises |Neutral | $107.00|$106.00 | |Brian Meredith |UBS |Lowers |Buy | $127.00|$131.00 | |Michael Phillips |Morgan Stanley |Lowers |Overweight | $110.00|$115.00 | |Meyer Shields |Keefe, Bruyette & Woods|Lowers |Outperform | $113.00|$120.00 | |Scott Heleniak |RBC Capital |Lowers |Outperform | $110.00|$125.00 | |Elyse Greenspan |Wells Fargo |Lowers |Overweight | $106.00|$107.00 | |Matthew Carletti |JMP Securities |Maintains |Market Outperform| $125.00|$125.00 | |Elyse Greenspan |Wells Fargo |Lowers |Overweight | $107.00|$109.00 | |Meyer Shields |Keefe, Bruyette & Woods|Lowers |Outperform | $120.00|$121.00 |
Key Insights:
- Action Taken: In response to dynamic market conditions and company performance, analysts update their recommendations. Whether they 'Maintain', 'Raise', or 'Lower' their stance, it signifies their reaction to recent developments related to Arch Capital Group. This insight gives a snapshot of analysts' perspectives on the current state of the company.
- Rating: Delving into assessments, analysts assign qualitative values, from 'Outperform' to 'Underperform'. These ratings communicate expectations for the relative performance of Arch Capital Group compared to the broader market.
- Price Targets: Analysts gauge the dynamics of price targets, providing estimates for the future value of Arch Capital Group's stock. This comparison reveals trends in analysts' expectations over time.
Analyzing these analyst evaluations alongside relevant financial metrics can provide a comprehensive view of Arch Capital Group's market position. Stay informed and make data-driven decisions with the assistance of our Ratings Table.
Stay up to date on Arch Capital Group analyst ratings.
Delving into Arch Capital Group's Background
Arch Capital Group Ltd is a Bermuda company that writes insurance and reinsurance with operations in the United States, Canada, Europe, Australia, and the United Kingdom. The business operates through three underwriting segments: insurance, reinsurance, and mortgage. The insurance segment provides specialty risk solutions to clients across various industries. The reinsurance segment provides reinsurance services which cover property catastrophe, property, liability, marine, aviation and space, trade credit and surety, agriculture, accident, life and health, and political risk. The mortgage business provides risk management and risk financing products to the mortgage insurance sectors through platforms in the U.S., Europe and Bermuda.
Key Indicators: Arch Capital Group's Financial Health
Market Capitalization Analysis: Above industry benchmarks, the company's market capitalization emphasizes a noteworthy size, indicative of a strong market presence.
Revenue Growth: Arch Capital Group's revenue growth over a period of 3M has been noteworthy. As of 31 December, 2024, the company achieved a revenue growth rate of approximately 19.09%. This indicates a substantial increase in the company's top-line earnings. As compared to its peers, the company achieved a growth rate higher than the average among peers in Financials sector.
Net Margin: Arch Capital Group's net margin surpasses industry standards, highlighting the company's exceptional financial performance. With an impressive 20.51% net margin, the company effectively manages costs and achieves strong profitability.
Return on Equity (ROE): Arch Capital Group's ROE stands out, surpassing industry averages. With an impressive ROE of 4.46%, the company demonstrates effective use of equity capital and strong financial performance.
Return on Assets (ROA): The company's ROA is a standout performer, exceeding industry averages. With an impressive ROA of 1.28%, the company showcases effective utilization of assets.
Debt Management: The company maintains a balanced debt approach with a debt-to-equity ratio below industry norms, standing at 0.14.
What Are Analyst Ratings?
Ratings come from analysts, or specialists within banking and financial systems that report for specific stocks or defined sectors (typically once per quarter for each stock). Analysts usually derive their information from company conference calls and meetings, financial statements, and conversations with important insiders to reach their decisions.
Some analysts also offer predictions for helpful metrics such as earnings, revenue, and growth estimates to provide further guidance as to what to do with certain tickers. It is important to keep in mind that while stock and sector analysts are specialists, they are also human and can only forecast their beliefs to traders.
Which Stocks Are Analysts Recommending Now?
Benzinga Edge gives you instant access to all major analyst upgrades, downgrades, and price targets. Sort by accuracy, upside potential, and more. Click here to stay ahead of the market.
This article was generated by Benzinga's automated content engine and reviewed by an editor.
Edge Rankings
Price Trend
© 2025 Benzinga.com. Benzinga does not provide investment advice. All rights reserved.
date | ticker | name | Price Target | Upside/Downside | Recommendation | Firm |
|---|
Trade confidently with insights and alerts from analyst ratings, free reports and breaking news that affects the stocks you care about.

