


In the preceding three months, 6 analysts have released ratings for Phillips 66 PSX, presenting a wide array of perspectives from bullish to bearish.
The table below provides a concise overview of recent ratings by analysts, offering insights into the changing sentiments over the past 30 days and drawing comparisons with the preceding months for a holistic perspective.
| Bullish | Somewhat Bullish | Indifferent | Somewhat Bearish | Bearish | |
|---|---|---|---|---|---|
| Total Ratings | 0 | 2 | 4 | 0 | 0 |
| Last 30D | 0 | 1 | 1 | 0 | 0 |
| 1M Ago | 0 | 0 | 2 | 0 | 0 |
| 2M Ago | 0 | 0 | 0 | 0 | 0 |
| 3M Ago | 0 | 1 | 1 | 0 | 0 |
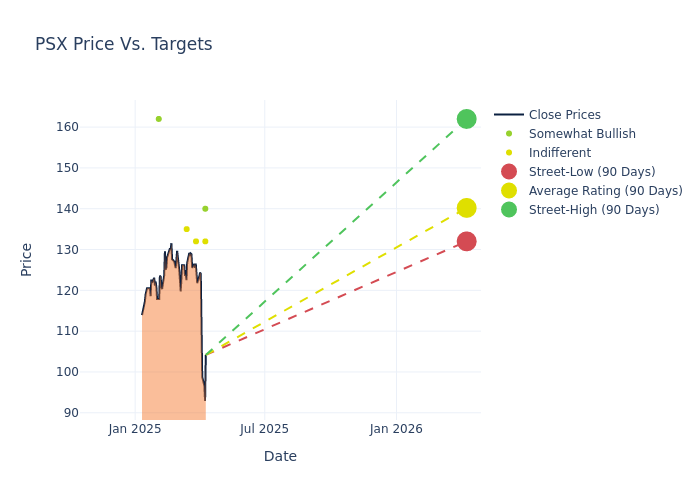
Analysts have set 12-month price targets for Phillips 66, revealing an average target of $136.0, a high estimate of $162.00, and a low estimate of $115.00. A decline of 0.73% from the prior average price target is evident in the current average.
Diving into Analyst Ratings: An In-Depth Exploration
A comprehensive examination of how financial experts perceive Phillips 66 is derived from recent analyst actions. The following is a detailed summary of key analysts, their recent evaluations, and adjustments to ratings and price targets.
| Analyst | Analyst Firm | Action Taken | Rating |Current Price Target| Prior Price Target | |--------------------|--------------------|---------------|---------------|--------------------|--------------------| |Justin Jenkins |Raymond James |Lowers |Outperform | $140.00|$150.00 | |Nitin Kumar |Mizuho |Lowers |Neutral | $132.00|$140.00 | |Neil Mehta |Goldman Sachs |Maintains |Neutral | $132.00|$132.00 | |Theresa Chen |Barclays |Raises |Equal-Weight | $135.00|$115.00 | |Roger Read |Wells Fargo |Raises |Overweight | $162.00|$161.00 | |Theresa Chen |Barclays |Lowers |Equal-Weight | $115.00|$124.00 |
Key Insights:
- Action Taken: Analysts adapt their recommendations to changing market conditions and company performance. Whether they 'Maintain', 'Raise' or 'Lower' their stance, it reflects their response to recent developments related to Phillips 66. This information provides a snapshot of how analysts perceive the current state of the company.
- Rating: Offering insights into predictions, analysts assign qualitative values, from 'Outperform' to 'Underperform'. These ratings convey expectations for the relative performance of Phillips 66 compared to the broader market.
- Price Targets: Analysts gauge the dynamics of price targets, providing estimates for the future value of Phillips 66's stock. This comparison reveals trends in analysts' expectations over time.
Capture valuable insights into Phillips 66's market standing by understanding these analyst evaluations alongside pertinent financial indicators. Stay informed and make strategic decisions with our Ratings Table.
Stay up to date on Phillips 66 analyst ratings.
Unveiling the Story Behind Phillips 66
Phillips 66 is an independent refiner that owns or holds interest in 11 refineries with a total crude throughput capacity of 1.8 million barrels per day, or mmb/d, at the end of 2024. The midstream segment comprises extensive transportation and NGL processing assets. It includes 70,000 miles of crude oil, refined petroleum product, NGL and natural gas pipeline systems, and a comprehensive set of refined petroleum product, NGL and crude oil terminals, gathering and processing plants and fractionation facilities and various other storage and loading facilities. Its CPChem chemical joint venture operates facilities primarily in the United States and the Middle East and produces olefins and polyolefins.
Phillips 66's Financial Performance
Market Capitalization: Exceeding industry standards, the company's market capitalization places it above industry average in size relative to peers. This emphasizes its significant scale and robust market position.
Revenue Growth: Phillips 66's revenue growth over a period of 3M has faced challenges. As of 31 December, 2024, the company experienced a revenue decline of approximately -11.98%. This indicates a decrease in the company's top-line earnings. As compared to its peers, the revenue growth lags behind its industry peers. The company achieved a growth rate lower than the average among peers in Energy sector.
Net Margin: Phillips 66's net margin surpasses industry standards, highlighting the company's exceptional financial performance. With an impressive 0.02% net margin, the company effectively manages costs and achieves strong profitability.
Return on Equity (ROE): Phillips 66's ROE stands out, surpassing industry averages. With an impressive ROE of 0.02%, the company demonstrates effective use of equity capital and strong financial performance.
Return on Assets (ROA): The company's ROA is a standout performer, exceeding industry averages. With an impressive ROA of 0.01%, the company showcases effective utilization of assets.
Debt Management: Phillips 66's debt-to-equity ratio is below industry norms, indicating a sound financial structure with a ratio of 0.73.
What Are Analyst Ratings?
Analysts work in banking and financial systems and typically specialize in reporting for stocks or defined sectors. Analysts may attend company conference calls and meetings, research company financial statements, and communicate with insiders to publish "analyst ratings" for stocks. Analysts typically rate each stock once per quarter.
Some analysts also offer predictions for helpful metrics such as earnings, revenue, and growth estimates to provide further guidance as to what to do with certain tickers. It is important to keep in mind that while stock and sector analysts are specialists, they are also human and can only forecast their beliefs to traders.
Which Stocks Are Analysts Recommending Now?
Benzinga Edge gives you instant access to all major analyst upgrades, downgrades, and price targets. Sort by accuracy, upside potential, and more. Click here to stay ahead of the market.
This article was generated by Benzinga's automated content engine and reviewed by an editor.
Edge Rankings
Price Trend
© 2025 Benzinga.com. Benzinga does not provide investment advice. All rights reserved.
date | ticker | name | Price Target | Upside/Downside | Recommendation | Firm |
|---|
Trade confidently with insights and alerts from analyst ratings, free reports and breaking news that affects the stocks you care about.

