


Ratings for UMB Financial UMBF were provided by 6 analysts in the past three months, showcasing a mix of bullish and bearish perspectives.
The following table provides a quick overview of their recent ratings, highlighting the changing sentiments over the past 30 days and comparing them to the preceding months.
| Bullish | Somewhat Bullish | Indifferent | Somewhat Bearish | Bearish | |
|---|---|---|---|---|---|
| Total Ratings | 0 | 3 | 3 | 0 | 0 |
| Last 30D | 0 | 0 | 1 | 0 | 0 |
| 1M Ago | 0 | 2 | 0 | 0 | 0 |
| 2M Ago | 0 | 0 | 0 | 0 | 0 |
| 3M Ago | 0 | 1 | 2 | 0 | 0 |
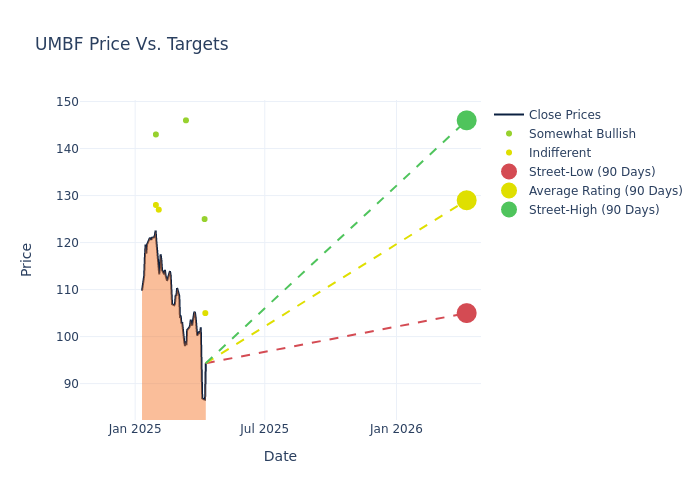
Analysts provide deeper insights through their assessments of 12-month price targets, revealing an average target of $129.0, a high estimate of $146.00, and a low estimate of $105.00. A 5.03% drop is evident in the current average compared to the previous average price target of $135.83.
Analyzing Analyst Ratings: A Detailed Breakdown
The perception of UMB Financial by financial experts is analyzed through recent analyst actions. The following summary presents key analysts, their recent evaluations, and adjustments to ratings and price targets.
| Analyst | Analyst Firm | Action Taken | Rating |Current Price Target| Prior Price Target | |--------------------|--------------------|---------------|---------------|--------------------|--------------------| |Timur Braziler |Wells Fargo |Lowers |Equal-Weight | $105.00|$120.00 | |Jared Shaw |Barclays |Lowers |Overweight | $125.00|$139.00 | |Brian Wilczynski |Morgan Stanley |Lowers |Overweight | $146.00|$156.00 | |Benjamin Gerlinger |Citigroup |Lowers |Neutral | $127.00|$130.00 | |Jon Arfstrom |RBC Capital |Maintains |Sector Perform | $128.00|$128.00 | |Nathan Race |Piper Sandler |Raises |Overweight | $143.00|$142.00 |
Key Insights:
- Action Taken: In response to dynamic market conditions and company performance, analysts update their recommendations. Whether they 'Maintain', 'Raise', or 'Lower' their stance, it signifies their reaction to recent developments related to UMB Financial. This insight gives a snapshot of analysts' perspectives on the current state of the company.
- Rating: Offering insights into predictions, analysts assign qualitative values, from 'Outperform' to 'Underperform'. These ratings convey expectations for the relative performance of UMB Financial compared to the broader market.
- Price Targets: Analysts navigate through adjustments in price targets, providing estimates for UMB Financial's future value. Comparing current and prior targets offers insights into analysts' evolving expectations.
Analyzing these analyst evaluations alongside relevant financial metrics can provide a comprehensive view of UMB Financial's market position. Stay informed and make data-driven decisions with the assistance of our Ratings Table.
Stay up to date on UMB Financial analyst ratings.
Discovering UMB Financial: A Closer Look
UMB Financial Corp, or UMBF, is a financial services holding company offering a suite of banking services and asset servicing to its customers in the United States and around the world. Its client base includes commercial, institutional, and personal customers. Along with its subsidiaries, the company operates in the following business segments: Commercial Banking, Institutional Banking, and Personal Banking. A majority of its revenue is generated from the Commercial Banking segment, which serves the commercial banking and treasury management needs of small to middle-market businesses through various products and services such as commercial loans, commercial real estate financing, commercial credit cards, letters of credit, loan syndication services, consultative services, and others.
Understanding the Numbers: UMB Financial's Finances
Market Capitalization Analysis: Positioned below industry benchmarks, the company's market capitalization faces constraints in size. This could be influenced by factors such as growth expectations or operational capacity.
Revenue Growth: UMB Financial's revenue growth over a period of 3M has been noteworthy. As of 31 December, 2024, the company achieved a revenue growth rate of approximately 17.74%. This indicates a substantial increase in the company's top-line earnings. As compared to competitors, the company encountered difficulties, with a growth rate lower than the average among peers in the Financials sector.
Net Margin: The company's net margin is a standout performer, exceeding industry averages. With an impressive net margin of 30.44%, the company showcases strong profitability and effective cost control.
Return on Equity (ROE): UMB Financial's ROE excels beyond industry benchmarks, reaching 3.43%. This signifies robust financial management and efficient use of shareholder equity capital.
Return on Assets (ROA): UMB Financial's ROA lags behind industry averages, suggesting challenges in maximizing returns from its assets. With an ROA of 0.25%, the company may face hurdles in achieving optimal financial performance.
Debt Management: The company maintains a balanced debt approach with a debt-to-equity ratio below industry norms, standing at 0.11.
The Basics of Analyst Ratings
Analyst ratings serve as essential indicators of stock performance, provided by experts in banking and financial systems. These specialists diligently analyze company financial statements, participate in conference calls, and engage with insiders to generate quarterly ratings for individual stocks.
Beyond their standard evaluations, some analysts contribute predictions for metrics like growth estimates, earnings, and revenue, furnishing investors with additional guidance. Users of analyst ratings should be mindful that this specialized advice is shaped by human perspectives and may be subject to variability.
Which Stocks Are Analysts Recommending Now?
Benzinga Edge gives you instant access to all major analyst upgrades, downgrades, and price targets. Sort by accuracy, upside potential, and more. Click here to stay ahead of the market.
This article was generated by Benzinga's automated content engine and reviewed by an editor.
Edge Rankings
Price Trend
© 2025 Benzinga.com. Benzinga does not provide investment advice. All rights reserved.
date | ticker | name | Price Target | Upside/Downside | Recommendation | Firm |
|---|
Trade confidently with insights and alerts from analyst ratings, free reports and breaking news that affects the stocks you care about.

