


Ratings for Park Hotels & Resorts PK were provided by 4 analysts in the past three months, showcasing a mix of bullish and bearish perspectives.
The following table provides a quick overview of their recent ratings, highlighting the changing sentiments over the past 30 days and comparing them to the preceding months.
| Bullish | Somewhat Bullish | Indifferent | Somewhat Bearish | Bearish | |
|---|---|---|---|---|---|
| Total Ratings | 1 | 0 | 3 | 0 | 0 |
| Last 30D | 0 | 0 | 1 | 0 | 0 |
| 1M Ago | 1 | 0 | 0 | 0 | 0 |
| 2M Ago | 0 | 0 | 1 | 0 | 0 |
| 3M Ago | 0 | 0 | 1 | 0 | 0 |
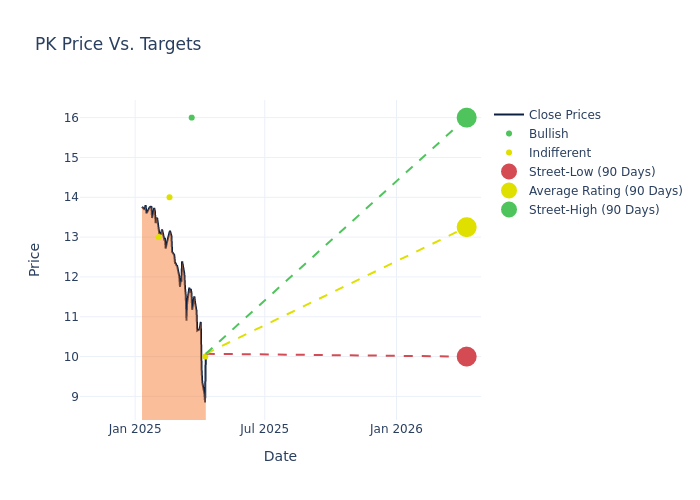
Analysts have recently evaluated Park Hotels & Resorts and provided 12-month price targets. The average target is $13.25, accompanied by a high estimate of $16.00 and a low estimate of $10.00. A negative shift in sentiment is evident as analysts have decreased the average price target by 23.19%.
Decoding Analyst Ratings: A Detailed Look
A clear picture of Park Hotels & Resorts's perception among financial experts is painted with a thorough analysis of recent analyst actions. The summary below outlines key analysts, their recent evaluations, and adjustments to ratings and price targets.
| Analyst | Analyst Firm | Action Taken | Rating |Current Price Target| Prior Price Target | |--------------------|--------------------|---------------|---------------|--------------------|--------------------| |David Katz |Jefferies |Lowers |Hold | $10.00|$19.00 | |Patrick Scholes |Truist Securities |Lowers |Buy | $16.00|$18.00 | |Dori Kesten |Wells Fargo |Lowers |Equal-Weight | $14.00|$17.00 | |Robin Farley |UBS |Lowers |Neutral | $13.00|$15.00 |
Key Insights:
- Action Taken: Analysts respond to changes in market conditions and company performance, frequently updating their recommendations. Whether they 'Maintain', 'Raise' or 'Lower' their stance, it reflects their reaction to recent developments related to Park Hotels & Resorts. This information offers a snapshot of how analysts perceive the current state of the company.
- Rating: Delving into assessments, analysts assign qualitative values, from 'Outperform' to 'Underperform'. These ratings communicate expectations for the relative performance of Park Hotels & Resorts compared to the broader market.
- Price Targets: Understanding forecasts, analysts offer estimates for Park Hotels & Resorts's future value. Examining the current and prior targets provides insight into analysts' changing expectations.
Capture valuable insights into Park Hotels & Resorts's market standing by understanding these analyst evaluations alongside pertinent financial indicators. Stay informed and make strategic decisions with our Ratings Table.
Stay up to date on Park Hotels & Resorts analyst ratings.
About Park Hotels & Resorts
Park Hotels & Resorts owns upper-upscale and luxury hotels with 22,711 rooms across 37 hotels in the United States. Park also has interests through joint ventures in another 2,271 rooms in three US hotels. Park was spun out of narrow-moat Hilton Worldwide Holdings at the start of 2017, so most of the company's hotels are still under Hilton brands. The company has sold all its international hotels and many of its lower-quality US hotels to focus on high-quality assets in domestic gateway markets.
Park Hotels & Resorts: Financial Performance Dissected
Market Capitalization Analysis: With a profound presence, the company's market capitalization is above industry averages. This reflects substantial size and strong market recognition.
Revenue Growth: Park Hotels & Resorts's revenue growth over a period of 3M has faced challenges. As of 31 December, 2024, the company experienced a revenue decline of approximately -4.87%. This indicates a decrease in the company's top-line earnings. When compared to others in the Real Estate sector, the company faces challenges, achieving a growth rate lower than the average among peers.
Net Margin: Park Hotels & Resorts's net margin surpasses industry standards, highlighting the company's exceptional financial performance. With an impressive 10.4% net margin, the company effectively manages costs and achieves strong profitability.
Return on Equity (ROE): Park Hotels & Resorts's ROE stands out, surpassing industry averages. With an impressive ROE of 1.76%, the company demonstrates effective use of equity capital and strong financial performance.
Return on Assets (ROA): Park Hotels & Resorts's ROA surpasses industry standards, highlighting the company's exceptional financial performance. With an impressive 0.71% ROA, the company effectively utilizes its assets for optimal returns.
Debt Management: The company maintains a balanced debt approach with a debt-to-equity ratio below industry norms, standing at 1.31.
The Significance of Analyst Ratings Explained
Analysts are specialists within banking and financial systems that typically report for specific stocks or within defined sectors. These people research company financial statements, sit in conference calls and meetings, and speak with relevant insiders to determine what are known as analyst ratings for stocks. Typically, analysts will rate each stock once a quarter.
Some analysts publish their predictions for metrics such as growth estimates, earnings, and revenue to provide additional guidance with their ratings. When using analyst ratings, it is important to keep in mind that stock and sector analysts are also human and are only offering their opinions to investors.
If you want to keep track of which analysts are outperforming others, you can view updated analyst ratings along withanalyst success scores in Benzinga Pro.
Breaking: Wall Street's Next Big Mover
Benzinga's #1 analyst just identified a stock poised for explosive growth. This under-the-radar company could surge 200%+ as major market shifts unfold. Click here for urgent details.
This article was generated by Benzinga's automated content engine and reviewed by an editor.
Edge Rankings
Price Trend
© 2025 Benzinga.com. Benzinga does not provide investment advice. All rights reserved.
date | ticker | name | Price Target | Upside/Downside | Recommendation | Firm |
|---|
Trade confidently with insights and alerts from analyst ratings, free reports and breaking news that affects the stocks you care about.

