


Analysts' ratings for Compass COMP over the last quarter vary from bullish to bearish, as provided by 12 analysts.
Summarizing their recent assessments, the table below illustrates the evolving sentiments in the past 30 days and compares them to the preceding months.
| Bullish | Somewhat Bullish | Indifferent | Somewhat Bearish | Bearish | |
|---|---|---|---|---|---|
| Total Ratings | 9 | 1 | 2 | 0 | 0 |
| Last 30D | 1 | 0 | 0 | 0 | 0 |
| 1M Ago | 3 | 0 | 0 | 0 | 0 |
| 2M Ago | 4 | 1 | 2 | 0 | 0 |
| 3M Ago | 1 | 0 | 0 | 0 | 0 |
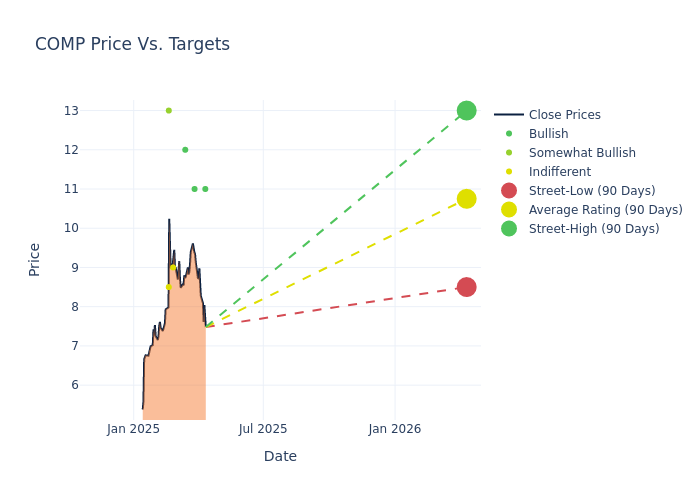
In the assessment of 12-month price targets, analysts unveil insights for Compass, presenting an average target of $10.71, a high estimate of $13.00, and a low estimate of $8.50. Witnessing a positive shift, the current average has risen by 12.74% from the previous average price target of $9.50.
Exploring Analyst Ratings: An In-Depth Overview
In examining recent analyst actions, we gain insights into how financial experts perceive Compass. The following summary outlines key analysts, their recent evaluations, and adjustments to ratings and price targets.
| Analyst | Analyst Firm | Action Taken | Rating |Current Price Target| Prior Price Target | |--------------------|--------------------|---------------|---------------|--------------------|--------------------| |Lloyd Walmsley |UBS |Lowers |Buy | $11.00|$12.00 | |Michael Ng |Goldman Sachs |Raises |Buy | $11.00|$10.00 | |Michael Ng |Goldman Sachs |Raises |Buy | $10.00|$9.00 | |Bernie McTernan |Needham |Maintains |Buy | $12.00|$12.00 | |Matthew Bouley |Barclays |Raises |Equal-Weight | $9.00|$7.00 | |Brian Nowak |Morgan Stanley |Raises |Equal-Weight | $8.50|$6.00 | |Jason Helfstein |Oppenheimer |Raises |Outperform | $13.00|$12.00 | |Michael Ng |Goldman Sachs |Raises |Buy | $9.00|$8.00 | |Lloyd Walmsley |UBS |Raises |Buy | $12.00|$11.00 | |Bernie McTernan |Needham |Raises |Buy | $12.00|$10.00 | |Lloyd Walmsley |UBS |Raises |Buy | $11.00|$7.00 | |Bernie McTernan |Needham |Maintains |Buy | $10.00|$10.00 |
Key Insights:
- Action Taken: Analysts respond to changes in market conditions and company performance, frequently updating their recommendations. Whether they 'Maintain', 'Raise' or 'Lower' their stance, it reflects their reaction to recent developments related to Compass. This information offers a snapshot of how analysts perceive the current state of the company.
- Rating: Offering a comprehensive view, analysts assess stocks qualitatively, spanning from 'Outperform' to 'Underperform'. These ratings convey expectations for the relative performance of Compass compared to the broader market.
- Price Targets: Analysts explore the dynamics of price targets, providing estimates for the future value of Compass's stock. This examination reveals shifts in analysts' expectations over time.
For valuable insights into Compass's market performance, consider these analyst evaluations alongside crucial financial indicators. Stay well-informed and make prudent decisions using our Ratings Table.
Stay up to date on Compass analyst ratings.
All You Need to Know About Compass
Compass Inc provides an end-to-end platform that empowers residential real estate agents to deliver exceptional service to seller and buyer clients. The platform includes an integrated suite of cloud-based software for customer relationship management, marketing, client service and other critical functionality, all custom-built for the real estate industry and enabling core brokerage services. Business operations are conducted in the United States and earn revenue domestically.
Compass's Financial Performance
Market Capitalization: Indicating a reduced size compared to industry averages, the company's market capitalization poses unique challenges.
Revenue Growth: Compass's revenue growth over a period of 3M has been noteworthy. As of 31 December, 2024, the company achieved a revenue growth rate of approximately 25.9%. This indicates a substantial increase in the company's top-line earnings. In comparison to its industry peers, the company stands out with a growth rate higher than the average among peers in the Real Estate sector.
Net Margin: Compass's net margin lags behind industry averages, suggesting challenges in maintaining strong profitability. With a net margin of -2.93%, the company may face hurdles in effective cost management.
Return on Equity (ROE): Compass's ROE falls below industry averages, indicating challenges in efficiently using equity capital. With an ROE of -9.67%, the company may face hurdles in generating optimal returns for shareholders.
Return on Assets (ROA): The company's ROA is below industry benchmarks, signaling potential difficulties in efficiently utilizing assets. With an ROA of -3.41%, the company may need to address challenges in generating satisfactory returns from its assets.
Debt Management: With a below-average debt-to-equity ratio of 1.22, Compass adopts a prudent financial strategy, indicating a balanced approach to debt management.
How Are Analyst Ratings Determined?
Analyst ratings serve as essential indicators of stock performance, provided by experts in banking and financial systems. These specialists diligently analyze company financial statements, participate in conference calls, and engage with insiders to generate quarterly ratings for individual stocks.
Some analysts also offer predictions for helpful metrics such as earnings, revenue, and growth estimates to provide further guidance as to what to do with certain tickers. It is important to keep in mind that while stock and sector analysts are specialists, they are also human and can only forecast their beliefs to traders.
Which Stocks Are Analysts Recommending Now?
Benzinga Edge gives you instant access to all major analyst upgrades, downgrades, and price targets. Sort by accuracy, upside potential, and more. Click here to stay ahead of the market.
This article was generated by Benzinga's automated content engine and reviewed by an editor.
© 2025 Benzinga.com. Benzinga does not provide investment advice. All rights reserved.
date | ticker | name | Price Target | Upside/Downside | Recommendation | Firm |
|---|
Trade confidently with insights and alerts from analyst ratings, free reports and breaking news that affects the stocks you care about.

