


During the last three months, 6 analysts shared their evaluations of ANI Pharmaceuticals ANIP, revealing diverse outlooks from bullish to bearish.
The table below provides a snapshot of their recent ratings, showcasing how sentiments have evolved over the past 30 days and comparing them to the preceding months.
| Bullish | Somewhat Bullish | Indifferent | Somewhat Bearish | Bearish | |
|---|---|---|---|---|---|
| Total Ratings | 5 | 1 | 0 | 0 | 0 |
| Last 30D | 1 | 0 | 0 | 0 | 0 |
| 1M Ago | 2 | 1 | 0 | 0 | 0 |
| 2M Ago | 2 | 0 | 0 | 0 | 0 |
| 3M Ago | 0 | 0 | 0 | 0 | 0 |
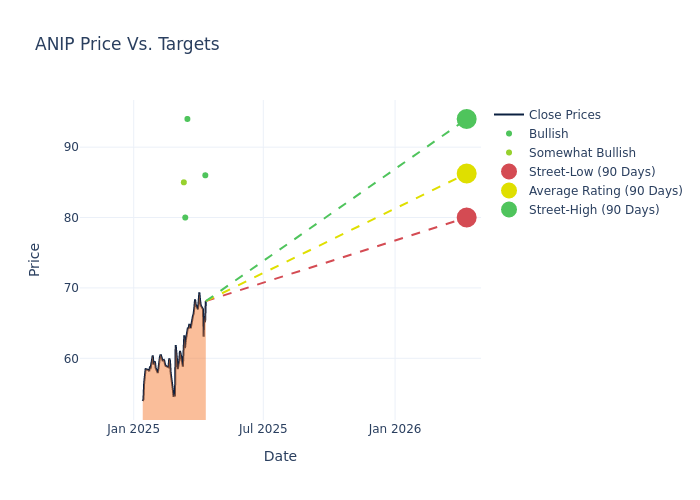
The 12-month price targets assessed by analysts reveal further insights, featuring an average target of $87.5, a high estimate of $94.00, and a low estimate of $80.00. This current average has decreased by 2.23% from the previous average price target of $89.50.
Decoding Analyst Ratings: A Detailed Look
The analysis of recent analyst actions sheds light on the perception of ANI Pharmaceuticals by financial experts. The following summary presents key analysts, their recent evaluations, and adjustments to ratings and price targets.
| Analyst | Analyst Firm | Action Taken | Rating |Current Price Target| Prior Price Target | |--------------------|--------------------|---------------|---------------|--------------------|--------------------| |Vamil Divan |Guggenheim |Maintains |Buy | $86.00|$86.00 | |Oren Livnat |HC Wainwright & Co. |Maintains |Buy | $94.00|$94.00 | |Glen Santangelo |Jefferies |Announces |Buy | $80.00|- | |Ekaterina Knyazkova |JP Morgan |Announces |Overweight | $85.00|- | |Vamil Divan |Guggenheim |Raises |Buy | $86.00|$84.00 | |Oren Livnat |HC Wainwright & Co. |Maintains |Buy | $94.00|$94.00 |
Key Insights:
- Action Taken: Analysts adapt their recommendations to changing market conditions and company performance. Whether they 'Maintain', 'Raise' or 'Lower' their stance, it reflects their response to recent developments related to ANI Pharmaceuticals. This information provides a snapshot of how analysts perceive the current state of the company.
- Rating: Analyzing trends, analysts offer qualitative evaluations, ranging from 'Outperform' to 'Underperform'. These ratings convey expectations for the relative performance of ANI Pharmaceuticals compared to the broader market.
- Price Targets: Analysts predict movements in price targets, offering estimates for ANI Pharmaceuticals's future value. Examining the current and prior targets offers insights into analysts' evolving expectations.
Navigating through these analyst evaluations alongside other financial indicators can contribute to a holistic understanding of ANI Pharmaceuticals's market standing. Stay informed and make data-driven decisions with our Ratings Table.
Stay up to date on ANI Pharmaceuticals analyst ratings.
If you are interested in following small-cap stock news and performance you can start by tracking it here.
Discovering ANI Pharmaceuticals: A Closer Look
ANI Pharmaceuticals Inc develops, manufactures, and markets generic prescription pharmaceuticals. It manufactures liquid, powder, and oral solid-dose products. Its areas of product development include narcotics, oncolytics, hormones and steroids, and complex formulations involving extended-release and combination products. Some of its generic products include Erythromycin ethyl succinate, Esterified Estrogen with Methyltestosterone (EEMT), Etodolac Fenofibrate, Fluvoxamine, Hydrocortisone Enema and Vancomycin. The company operates in two segments which include Rare Diseases and Brands, Generics, and Others. Its geographical segments are the United States and Canada, of which the majority of its revenue comes from the United States.
ANI Pharmaceuticals's Economic Impact: An Analysis
Market Capitalization: With restricted market capitalization, the company is positioned below industry averages. This reflects a smaller scale relative to peers.
Revenue Growth: ANI Pharmaceuticals's remarkable performance in 3M is evident. As of 31 December, 2024, the company achieved an impressive revenue growth rate of 44.75%. This signifies a substantial increase in the company's top-line earnings. As compared to its peers, the revenue growth lags behind its industry peers. The company achieved a growth rate lower than the average among peers in Health Care sector.
Net Margin: ANI Pharmaceuticals's net margin is impressive, surpassing industry averages. With a net margin of -5.61%, the company demonstrates strong profitability and effective cost management.
Return on Equity (ROE): The company's ROE is a standout performer, exceeding industry averages. With an impressive ROE of -2.64%, the company showcases effective utilization of equity capital.
Return on Assets (ROA): The company's ROA is a standout performer, exceeding industry averages. With an impressive ROA of -0.83%, the company showcases effective utilization of assets.
Debt Management: With a below-average debt-to-equity ratio of 1.55, ANI Pharmaceuticals adopts a prudent financial strategy, indicating a balanced approach to debt management.
The Core of Analyst Ratings: What Every Investor Should Know
Benzinga tracks 150 analyst firms and reports on their stock expectations. Analysts typically arrive at their conclusions by predicting how much money a company will make in the future, usually the upcoming five years, and how risky or predictable that company's revenue streams are.
Analysts attend company conference calls and meetings, research company financial statements, and communicate with insiders to publish their ratings on stocks. Analysts typically rate each stock once per quarter or whenever the company has a major update.
Analysts may supplement their ratings with predictions for metrics like growth estimates, earnings, and revenue, offering investors a more comprehensive outlook. However, investors should be mindful that analysts, like any human, can have subjective perspectives influencing their forecasts.
Which Stocks Are Analysts Recommending Now?
Benzinga Edge gives you instant access to all major analyst upgrades, downgrades, and price targets. Sort by accuracy, upside potential, and more. Click here to stay ahead of the market.
This article was generated by Benzinga's automated content engine and reviewed by an editor.
Edge Rankings
Price Trend
© 2025 Benzinga.com. Benzinga does not provide investment advice. All rights reserved.
date | ticker | name | Price Target | Upside/Downside | Recommendation | Firm |
|---|
Trade confidently with insights and alerts from analyst ratings, free reports and breaking news that affects the stocks you care about.

