


Flywire FLYW has been analyzed by 9 analysts in the last three months, revealing a diverse range of perspectives from bullish to bearish.
The table below offers a condensed view of their recent ratings, showcasing the changing sentiments over the past 30 days and comparing them to the preceding months.
| Bullish | Somewhat Bullish | Indifferent | Somewhat Bearish | Bearish | |
|---|---|---|---|---|---|
| Total Ratings | 1 | 1 | 6 | 1 | 0 |
| Last 30D | 0 | 0 | 0 | 1 | 0 |
| 1M Ago | 1 | 0 | 1 | 0 | 0 |
| 2M Ago | 0 | 1 | 5 | 0 | 0 |
| 3M Ago | 0 | 0 | 0 | 0 | 0 |
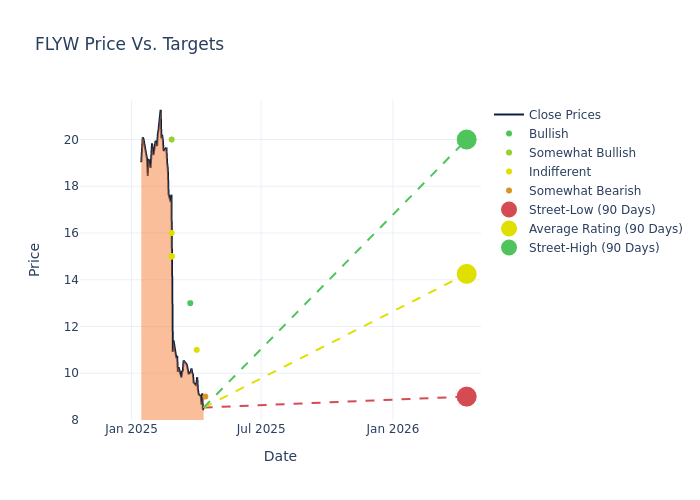
Providing deeper insights, analysts have established 12-month price targets, indicating an average target of $14.33, along with a high estimate of $20.00 and a low estimate of $9.00. A decline of 35.51% from the prior average price target is evident in the current average.
Exploring Analyst Ratings: An In-Depth Overview
In examining recent analyst actions, we gain insights into how financial experts perceive Flywire. The following summary outlines key analysts, their recent evaluations, and adjustments to ratings and price targets.
| Analyst | Analyst Firm | Action Taken | Rating |Current Price Target| Prior Price Target | |--------------------|--------------------|---------------|---------------|--------------------|--------------------| |Tien-Tsin Huang |JP Morgan |Lowers |Underweight | $9.00|$16.00 | |Will Nance |Goldman Sachs |Lowers |Neutral | $11.00|$15.00 | |Andrew Schmidt |Citigroup |Lowers |Buy | $13.00|$26.00 | |Will Nance |Goldman Sachs |Lowers |Neutral | $15.00|$26.00 | |Daniel Perlin |RBC Capital |Lowers |Outperform | $20.00|$25.00 | |James Faucette |Morgan Stanley |Lowers |Equal-Weight | $15.00|$21.00 | |Timothy Chiodo |UBS |Lowers |Neutral | $15.00|$25.00 | |Andrew Bauch |Wells Fargo |Lowers |Equal-Weight | $16.00|$20.00 | |Charles Nabhan |Stephens & Co. |Lowers |Equal-Weight | $15.00|$26.00 |
Key Insights:
- Action Taken: Analysts frequently update their recommendations based on evolving market conditions and company performance. Whether they 'Maintain', 'Raise' or 'Lower' their stance, it reflects their reaction to recent developments related to Flywire. This information provides a snapshot of how analysts perceive the current state of the company.
- Rating: Offering a comprehensive view, analysts assess stocks qualitatively, spanning from 'Outperform' to 'Underperform'. These ratings convey expectations for the relative performance of Flywire compared to the broader market.
- Price Targets: Analysts predict movements in price targets, offering estimates for Flywire's future value. Examining the current and prior targets offers insights into analysts' evolving expectations.
Considering these analyst evaluations in conjunction with other financial indicators can offer a comprehensive understanding of Flywire's market position. Stay informed and make well-informed decisions with our Ratings Table.
Stay up to date on Flywire analyst ratings.
If you are interested in following small-cap stock news and performance you can start by tracking it here.
Delving into Flywire's Background
Flywire Corp provides a secure payment platform, offering its clients a streamlined process to receive reconciled domestic and international payments more cost-effectively and efficiently. The company's solutions are built on three core elements namely a payments platform; a proprietary global payment network and vertical-specific software backed by its deep industry expertise. Geographically, the majority of revenue is from the Americas.
Unraveling the Financial Story of Flywire
Market Capitalization: Indicating a reduced size compared to industry averages, the company's market capitalization poses unique challenges.
Revenue Growth: Flywire displayed positive results in 3M. As of 31 December, 2024, the company achieved a solid revenue growth rate of approximately 16.91%. This indicates a notable increase in the company's top-line earnings. When compared to others in the Financials sector, the company excelled with a growth rate higher than the average among peers.
Net Margin: Flywire's net margin is impressive, surpassing industry averages. With a net margin of -13.53%, the company demonstrates strong profitability and effective cost management.
Return on Equity (ROE): The company's ROE is below industry benchmarks, signaling potential difficulties in efficiently using equity capital. With an ROE of -1.92%, the company may need to address challenges in generating satisfactory returns for shareholders.
Return on Assets (ROA): Flywire's ROA is below industry averages, indicating potential challenges in efficiently utilizing assets. With an ROA of -1.35%, the company may face hurdles in achieving optimal financial returns.
Debt Management: Flywire's debt-to-equity ratio is below the industry average. With a ratio of 0.0, the company relies less on debt financing, maintaining a healthier balance between debt and equity, which can be viewed positively by investors.
The Significance of Analyst Ratings Explained
Analysts are specialists within banking and financial systems that typically report for specific stocks or within defined sectors. These people research company financial statements, sit in conference calls and meetings, and speak with relevant insiders to determine what are known as analyst ratings for stocks. Typically, analysts will rate each stock once a quarter.
Analysts may enhance their evaluations by incorporating forecasts for metrics like growth estimates, earnings, and revenue, delivering additional guidance to investors. It is vital to acknowledge that, although experts in stocks and sectors, analysts are human and express their opinions when providing insights.
Breaking: Wall Street's Next Big Mover
Benzinga's #1 analyst just identified a stock poised for explosive growth. This under-the-radar company could surge 200%+ as major market shifts unfold. Click here for urgent details.
This article was generated by Benzinga's automated content engine and reviewed by an editor.
Edge Rankings
Price Trend
© 2025 Benzinga.com. Benzinga does not provide investment advice. All rights reserved.
date | ticker | name | Price Target | Upside/Downside | Recommendation | Firm |
|---|
Trade confidently with insights and alerts from analyst ratings, free reports and breaking news that affects the stocks you care about.

