


In the latest quarter, 20 analysts provided ratings for Microsoft MSFT, showcasing a mix of bullish and bearish perspectives.
The table below offers a condensed view of their recent ratings, showcasing the changing sentiments over the past 30 days and comparing them to the preceding months.
| Bullish | Somewhat Bullish | Indifferent | Somewhat Bearish | Bearish | |
|---|---|---|---|---|---|
| Total Ratings | 8 | 11 | 1 | 0 | 0 |
| Last 30D | 0 | 1 | 0 | 0 | 0 |
| 1M Ago | 5 | 4 | 0 | 0 | 0 |
| 2M Ago | 2 | 0 | 0 | 0 | 0 |
| 3M Ago | 1 | 6 | 1 | 0 | 0 |
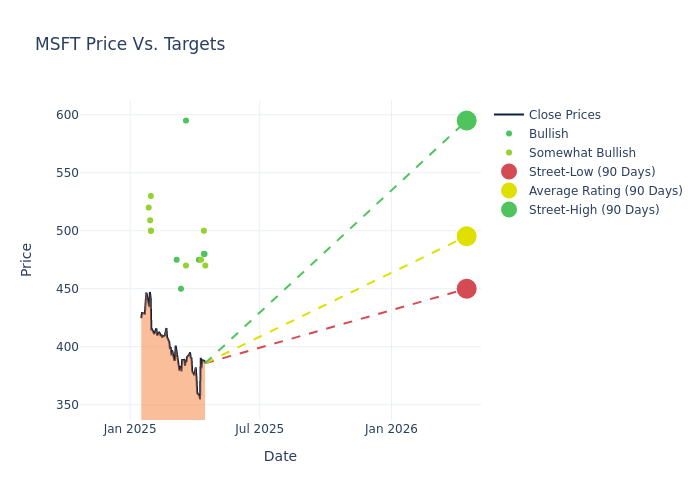
Insights from analysts' 12-month price targets are revealed, presenting an average target of $497.7, a high estimate of $595.00, and a low estimate of $425.00. A negative shift in sentiment is evident as analysts have decreased the average price target by 2.93%.
Decoding Analyst Ratings: A Detailed Look
The standing of Microsoft among financial experts becomes clear with a thorough analysis of recent analyst actions. The summary below outlines key analysts, their recent evaluations, and adjustments to ratings and price targets.
| Analyst | Analyst Firm | Action Taken | Rating |Current Price Target| Prior Price Target | |--------------------|--------------------|---------------|-----------------|--------------------|--------------------| |Keith Bachman |BMO Capital |Lowers |Outperform | $470.00|$490.00 | |Brad Sills |B of A Securities |Lowers |Buy | $480.00|$510.00 | |Karl Keirstead |UBS |Lowers |Buy | $480.00|$510.00 | |Michael Turrin |Wells Fargo |Lowers |Overweight | $500.00|$515.00 | |Daniel Ives |Wedbush |Lowers |Outperform | $475.00|$550.00 | |Brent Thill |Jefferies |Lowers |Buy | $475.00|$500.00 | |Brent Thill |Jefferies |Lowers |Buy | $500.00|$550.00 | |Ivan Feinseth |Tigress Financial |Raises |Buy | $595.00|$550.00 | |Daniel Ives |Wedbush |Maintains |Outperform | $550.00|$550.00 | |Patrick Colville |Scotiabank |Announces |Sector Outperform| $470.00|- | |Gil Luria |DA Davidson |Raises |Buy | $450.00|$425.00 | |Brad Reback |Stifel |Lowers |Buy | $475.00|$515.00 | |Karl Keirstead |UBS |Lowers |Buy | $510.00|$525.00 | |Gil Luria |DA Davidson |Maintains |Neutral | $425.00|$425.00 | |Rishi Jaluria |RBC Capital |Maintains |Outperform | $500.00|$500.00 | |Keith Weiss |Morgan Stanley |Lowers |Overweight | $530.00|$540.00 | |Gregg Moskowitz |Mizuho |Lowers |Outperform | $500.00|$510.00 | |Thomas Blakey |Cantor Fitzgerald |Maintains |Overweight | $509.00|$509.00 | |Brent Bracelin |Piper Sandler |Maintains |Overweight | $520.00|$520.00 | |Keith Weiss |Morgan Stanley |Lowers |Overweight | $540.00|$548.00 |
Key Insights:
- Action Taken: In response to dynamic market conditions and company performance, analysts update their recommendations. Whether they 'Maintain', 'Raise', or 'Lower' their stance, it signifies their reaction to recent developments related to Microsoft. This insight gives a snapshot of analysts' perspectives on the current state of the company.
- Rating: Analysts assign qualitative assessments to stocks, ranging from 'Outperform' to 'Underperform'. These ratings convey the analysts' expectations for the relative performance of Microsoft compared to the broader market.
- Price Targets: Analysts navigate through adjustments in price targets, providing estimates for Microsoft's future value. Comparing current and prior targets offers insights into analysts' evolving expectations.
Understanding these analyst evaluations alongside key financial indicators can offer valuable insights into Microsoft's market standing. Stay informed and make well-considered decisions with our Ratings Table.
Stay up to date on Microsoft analyst ratings.
About Microsoft
Microsoft develops and licenses consumer and enterprise software. It is known for its Windows operating systems and Office productivity suite. The company is organized into three equally sized broad segments: productivity and business processes (legacy Microsoft Office, cloud-based Office 365, Exchange, SharePoint, Skype, LinkedIn, Dynamics), intelligence cloud (infrastructure- and platform-as-a-service offerings Azure, Windows Server OS, SQL Server), and more personal computing (Windows Client, Xbox, Bing search, display advertising, and Surface laptops, tablets, and desktops).
Key Indicators: Microsoft's Financial Health
Market Capitalization Analysis: The company's market capitalization is above the industry average, indicating that it is relatively larger in size compared to peers. This may suggest a higher level of investor confidence and market recognition.
Revenue Growth: Microsoft's revenue growth over a period of 3M has been noteworthy. As of 31 December, 2024, the company achieved a revenue growth rate of approximately 12.27%. This indicates a substantial increase in the company's top-line earnings. As compared to competitors, the company encountered difficulties, with a growth rate lower than the average among peers in the Information Technology sector.
Net Margin: Microsoft's financial strength is reflected in its exceptional net margin, which exceeds industry averages. With a remarkable net margin of 34.62%, the company showcases strong profitability and effective cost management.
Return on Equity (ROE): Microsoft's ROE excels beyond industry benchmarks, reaching 8.17%. This signifies robust financial management and efficient use of shareholder equity capital.
Return on Assets (ROA): Microsoft's ROA stands out, surpassing industry averages. With an impressive ROA of 4.56%, the company demonstrates effective utilization of assets and strong financial performance.
Debt Management: Microsoft's debt-to-equity ratio is below the industry average. With a ratio of 0.21, the company relies less on debt financing, maintaining a healthier balance between debt and equity, which can be viewed positively by investors.
Analyst Ratings: Simplified
Within the domain of banking and financial systems, analysts specialize in reporting for specific stocks or defined sectors. Their work involves attending company conference calls and meetings, researching company financial statements, and communicating with insiders to publish "analyst ratings" for stocks. Analysts typically assess and rate each stock once per quarter.
Analysts may enhance their evaluations by incorporating forecasts for metrics like growth estimates, earnings, and revenue, delivering additional guidance to investors. It is vital to acknowledge that, although experts in stocks and sectors, analysts are human and express their opinions when providing insights.
Breaking: Wall Street's Next Big Mover
Benzinga's #1 analyst just identified a stock poised for explosive growth. This under-the-radar company could surge 200%+ as major market shifts unfold. Click here for urgent details.
This article was generated by Benzinga's automated content engine and reviewed by an editor.
Edge Rankings
Price Trend
© 2025 Benzinga.com. Benzinga does not provide investment advice. All rights reserved.
date | ticker | name | Price Target | Upside/Downside | Recommendation | Firm |
|---|
Trade confidently with insights and alerts from analyst ratings, free reports and breaking news that affects the stocks you care about.

