


Analysts' ratings for JD.com JD over the last quarter vary from bullish to bearish, as provided by 6 analysts.
The following table provides a quick overview of their recent ratings, highlighting the changing sentiments over the past 30 days and comparing them to the preceding months.
| Bullish | Somewhat Bullish | Indifferent | Somewhat Bearish | Bearish | |
|---|---|---|---|---|---|
| Total Ratings | 2 | 3 | 1 | 0 | 0 |
| Last 30D | 1 | 0 | 0 | 0 | 0 |
| 1M Ago | 0 | 0 | 0 | 0 | 0 |
| 2M Ago | 1 | 3 | 1 | 0 | 0 |
| 3M Ago | 0 | 0 | 0 | 0 | 0 |
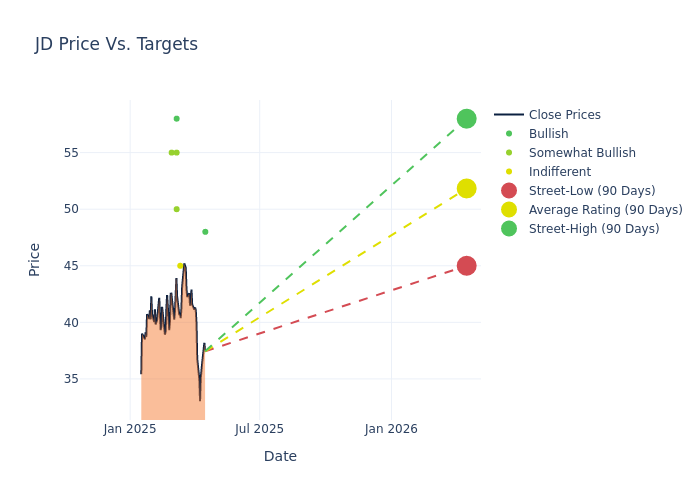
Analysts have set 12-month price targets for JD.com, revealing an average target of $51.83, a high estimate of $58.00, and a low estimate of $45.00. Surpassing the previous average price target of $46.00, the current average has increased by 12.67%.
Understanding Analyst Ratings: A Comprehensive Breakdown
The standing of JD.com among financial experts is revealed through an in-depth exploration of recent analyst actions. The summary below outlines key analysts, their recent evaluations, and adjustments to ratings and price targets.
| Analyst | Analyst Firm | Action Taken | Rating |Current Price Target| Prior Price Target | |--------------------|--------------------|---------------|---------------|--------------------|--------------------| |Joyce Ju |B of A Securities |Lowers |Buy | $48.00|$51.00 | |Shyam Patil |Susquehanna |Raises |Neutral | $45.00|$35.00 | |James Lee |Mizuho |Raises |Outperform | $50.00|$43.00 | |Andre Chang |JP Morgan |Raises |Overweight | $55.00|$50.00 | |Fawne Jiang |Benchmark |Raises |Buy | $58.00|$47.00 | |Gregory Zhao |Barclays |Raises |Overweight | $55.00|$50.00 |
Key Insights:
- Action Taken: In response to dynamic market conditions and company performance, analysts update their recommendations. Whether they 'Maintain', 'Raise', or 'Lower' their stance, it signifies their reaction to recent developments related to JD.com. This insight gives a snapshot of analysts' perspectives on the current state of the company.
- Rating: Offering insights into predictions, analysts assign qualitative values, from 'Outperform' to 'Underperform'. These ratings convey expectations for the relative performance of JD.com compared to the broader market.
- Price Targets: Analysts explore the dynamics of price targets, providing estimates for the future value of JD.com's stock. This examination reveals shifts in analysts' expectations over time.
Considering these analyst evaluations in conjunction with other financial indicators can offer a comprehensive understanding of JD.com's market position. Stay informed and make well-informed decisions with our Ratings Table.
Stay up to date on JD.com analyst ratings.
About JD.com
JD.com is the third-largest Chinese e-commerce platform by GMV in 2024. it offers a wide selection of authentic products with speedy and reliable delivery. The company has built its own nationwide fulfilment infrastructure and last-mile delivery network, staffed by its own employees, which supports both its online direct sales, its online marketplace and omnichannel businesses.
Financial Milestones: JD.com's Journey
Market Capitalization: Indicating a reduced size compared to industry averages, the company's market capitalization poses unique challenges.
Positive Revenue Trend: Examining JD.com's financials over 3M reveals a positive narrative. The company achieved a noteworthy revenue growth rate of 33.26% as of 31 December, 2024, showcasing a substantial increase in top-line earnings. As compared to its peers, the company achieved a growth rate higher than the average among peers in Consumer Discretionary sector.
Net Margin: JD.com's net margin is below industry standards, pointing towards difficulties in achieving strong profitability. With a net margin of 2.84%, the company may encounter challenges in effective cost control.
Return on Equity (ROE): JD.com's financial strength is reflected in its exceptional ROE, which exceeds industry averages. With a remarkable ROE of 4.21%, the company showcases efficient use of equity capital and strong financial health.
Return on Assets (ROA): JD.com's ROA stands out, surpassing industry averages. With an impressive ROA of 1.47%, the company demonstrates effective utilization of assets and strong financial performance.
Debt Management: JD.com's debt-to-equity ratio is below industry norms, indicating a sound financial structure with a ratio of 0.38.
Understanding the Relevance of Analyst Ratings
Within the domain of banking and financial systems, analysts specialize in reporting for specific stocks or defined sectors. Their work involves attending company conference calls and meetings, researching company financial statements, and communicating with insiders to publish "analyst ratings" for stocks. Analysts typically assess and rate each stock once per quarter.
Analysts may enhance their evaluations by incorporating forecasts for metrics like growth estimates, earnings, and revenue, delivering additional guidance to investors. It is vital to acknowledge that, although experts in stocks and sectors, analysts are human and express their opinions when providing insights.
Breaking: Wall Street's Next Big Mover
Benzinga's #1 analyst just identified a stock poised for explosive growth. This under-the-radar company could surge 200%+ as major market shifts unfold. Click here for urgent details.
This article was generated by Benzinga's automated content engine and reviewed by an editor.
Edge Rankings
Price Trend
© 2025 Benzinga.com. Benzinga does not provide investment advice. All rights reserved.
date | ticker | name | Price Target | Upside/Downside | Recommendation | Firm |
|---|
Trade confidently with insights and alerts from analyst ratings, free reports and breaking news that affects the stocks you care about.

