


Providing a diverse range of perspectives from bullish to bearish, 5 analysts have published ratings on Banner BANR in the last three months.
The table below provides a snapshot of their recent ratings, showcasing how sentiments have evolved over the past 30 days and comparing them to the preceding months.
| Bullish | Somewhat Bullish | Indifferent | Somewhat Bearish | Bearish | |
|---|---|---|---|---|---|
| Total Ratings | 0 | 3 | 2 | 0 | 0 |
| Last 30D | 0 | 2 | 1 | 0 | 0 |
| 1M Ago | 0 | 0 | 0 | 0 | 0 |
| 2M Ago | 0 | 0 | 0 | 0 | 0 |
| 3M Ago | 0 | 1 | 1 | 0 | 0 |
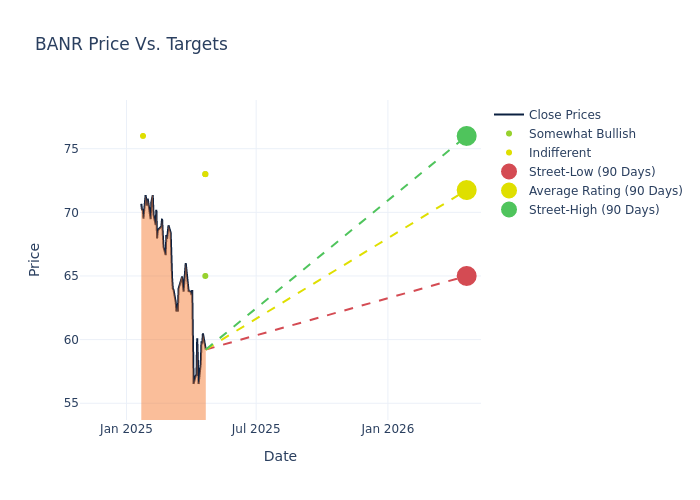
Providing deeper insights, analysts have established 12-month price targets, indicating an average target of $73.8, along with a high estimate of $82.00 and a low estimate of $65.00. A negative shift in sentiment is evident as analysts have decreased the average price target by 2.89%.
Understanding Analyst Ratings: A Comprehensive Breakdown
A clear picture of Banner's perception among financial experts is painted with a thorough analysis of recent analyst actions. The summary below outlines key analysts, their recent evaluations, and adjustments to ratings and price targets.
| Analyst | Analyst Firm | Action Taken | Rating |Current Price Target| Prior Price Target | |--------------------|-----------------------|---------------|---------------|--------------------|--------------------| |Andrew Terrell |Stephens & Co. |Maintains |Overweight | $73.00|$73.00 | |David Feaster |Raymond James |Lowers |Outperform | $65.00|$77.00 | |Kelly Motta |Keefe, Bruyette & Woods|Lowers |Market Perform | $73.00|$75.00 | |Jeffrey Rulis |DA Davidson |Raises |Neutral | $76.00|$73.00 | |Andrew Terrell |Stephens & Co. |Maintains |Overweight | $82.00|$82.00 |
Key Insights:
- Action Taken: Analysts adapt their recommendations to changing market conditions and company performance. Whether they 'Maintain', 'Raise' or 'Lower' their stance, it reflects their response to recent developments related to Banner. This information provides a snapshot of how analysts perceive the current state of the company.
- Rating: Analyzing trends, analysts offer qualitative evaluations, ranging from 'Outperform' to 'Underperform'. These ratings convey expectations for the relative performance of Banner compared to the broader market.
- Price Targets: Gaining insights, analysts provide estimates for the future value of Banner's stock. This comparison reveals trends in analysts' expectations over time.
Understanding these analyst evaluations alongside key financial indicators can offer valuable insights into Banner's market standing. Stay informed and make well-considered decisions with our Ratings Table.
Stay up to date on Banner analyst ratings.
Get to Know Banner Better
Banner Corp is a bank holding company. It wholly owns one subsidiary bank, Banner Bank. The Bank's primary business is that of traditional banking institutions, accepting deposits and originating loans in locations surrounding its offices in Washington, Oregon, California, Idaho and Utah. Banner Bank also actively participates in the secondary loan markets, engaging in mortgage banking operations largely through the origination and sale of one to four family residential loans.
Banner: Financial Performance Dissected
Market Capitalization Analysis: Below industry benchmarks, the company's market capitalization reflects a smaller scale relative to peers. This could be attributed to factors such as growth expectations or operational capacity.
Revenue Challenges: Banner's revenue growth over 3M faced difficulties. As of 31 March, 2025, the company experienced a decline of approximately -0.77%. This indicates a decrease in top-line earnings. When compared to others in the Financials sector, the company faces challenges, achieving a growth rate lower than the average among peers.
Net Margin: Banner's net margin is below industry averages, indicating potential challenges in maintaining strong profitability. With a net margin of 28.61%, the company may face hurdles in effective cost management.
Return on Equity (ROE): Banner's ROE is below industry averages, indicating potential challenges in efficiently utilizing equity capital. With an ROE of 2.5%, the company may face hurdles in achieving optimal financial returns.
Return on Assets (ROA): Banner's ROA falls below industry averages, indicating challenges in efficiently utilizing assets. With an ROA of 0.28%, the company may face hurdles in generating optimal returns from its assets.
Debt Management: Banner's debt-to-equity ratio is below the industry average at 0.27, reflecting a lower dependency on debt financing and a more conservative financial approach.
Analyst Ratings: What Are They?
Ratings come from analysts, or specialists within banking and financial systems that report for specific stocks or defined sectors (typically once per quarter for each stock). Analysts usually derive their information from company conference calls and meetings, financial statements, and conversations with important insiders to reach their decisions.
Some analysts publish their predictions for metrics such as growth estimates, earnings, and revenue to provide additional guidance with their ratings. When using analyst ratings, it is important to keep in mind that stock and sector analysts are also human and are only offering their opinions to investors.
Which Stocks Are Analysts Recommending Now?
Benzinga Edge gives you instant access to all major analyst upgrades, downgrades, and price targets. Sort by accuracy, upside potential, and more. Click here to stay ahead of the market.
This article was generated by Benzinga's automated content engine and reviewed by an editor.
Edge Rankings
Price Trend
© 2025 Benzinga.com. Benzinga does not provide investment advice. All rights reserved.
date | ticker | name | Price Target | Upside/Downside | Recommendation | Firm |
|---|
Trade confidently with insights and alerts from analyst ratings, free reports and breaking news that affects the stocks you care about.

