


During the last three months, 11 analysts shared their evaluations of Coursera COUR, revealing diverse outlooks from bullish to bearish.
The following table encapsulates their recent ratings, offering a glimpse into the evolving sentiments over the past 30 days and comparing them to the preceding months.
| Bullish | Somewhat Bullish | Indifferent | Somewhat Bearish | Bearish | |
|---|---|---|---|---|---|
| Total Ratings | 2 | 6 | 2 | 1 | 0 |
| Last 30D | 0 | 1 | 0 | 0 | 0 |
| 1M Ago | 0 | 1 | 1 | 1 | 0 |
| 2M Ago | 0 | 0 | 0 | 0 | 0 |
| 3M Ago | 2 | 4 | 1 | 0 | 0 |
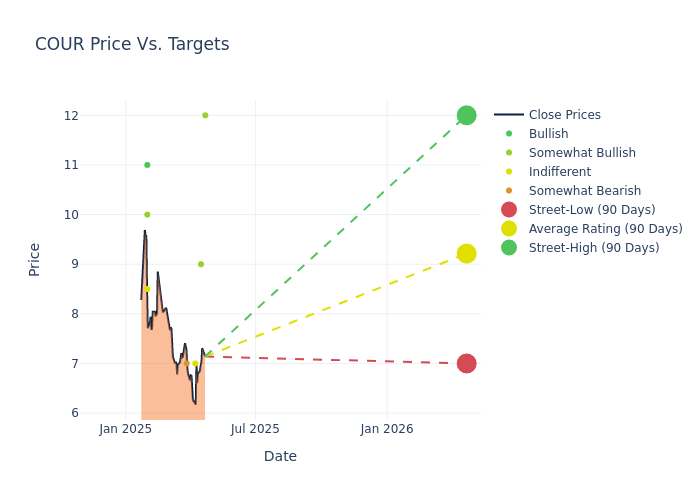
The 12-month price targets assessed by analysts reveal further insights, featuring an average target of $10.68, a high estimate of $15.00, and a low estimate of $7.00. A negative shift in sentiment is evident as analysts have decreased the average price target by 6.72%.
Interpreting Analyst Ratings: A Closer Look
The perception of Coursera by financial experts is analyzed through recent analyst actions. The following summary presents key analysts, their recent evaluations, and adjustments to ratings and price targets.
| Analyst | Analyst Firm | Action Taken | Rating |Current Price Target| Prior Price Target | |---------------------|---------------------|---------------|---------------|--------------------|--------------------| |Sarang Vora |Telsey Advisory Group|Maintains |Outperform | $12.00|$12.00 | |Josh Baer |Morgan Stanley |Lowers |Overweight | $9.00|$10.00 | |Bryan Smilek |JP Morgan |Lowers |Neutral | $7.00|$8.00 | |Nafeesa Gupta |B of A Securities |Announces |Underperform | $7.00|- | |Jennifer Swanson Lowe|UBS |Raises |Neutral | $8.50|$7.50 | |Rishi Jaluria |RBC Capital |Maintains |Outperform | $10.00|$10.00 | |Ryan MacDonald |Needham |Maintains |Buy | $11.00|$11.00 | |Sarang Vora |Telsey Advisory Group|Lowers |Outperform | $12.00|$15.00 | |Sarang Vora |Telsey Advisory Group|Maintains |Outperform | $15.00|$15.00 | |Sarang Vora |Telsey Advisory Group|Maintains |Outperform | $15.00|$15.00 | |Ryan MacDonald |Needham |Maintains |Buy | $11.00|$11.00 |
Key Insights:
- Action Taken: Responding to changing market dynamics and company performance, analysts update their recommendations. Whether they 'Maintain', 'Raise', or 'Lower' their stance, it signifies their response to recent developments related to Coursera. This offers insight into analysts' perspectives on the current state of the company.
- Rating: Gaining insights, analysts provide qualitative assessments, ranging from 'Outperform' to 'Underperform'. These ratings reflect expectations for the relative performance of Coursera compared to the broader market.
- Price Targets: Gaining insights, analysts provide estimates for the future value of Coursera's stock. This comparison reveals trends in analysts' expectations over time.
For valuable insights into Coursera's market performance, consider these analyst evaluations alongside crucial financial indicators. Stay well-informed and make prudent decisions using our Ratings Table.
Stay up to date on Coursera analyst ratings.
If you are interested in following small-cap stock news and performance you can start by tracking it here.
Get to Know Coursera Better
Coursera Inc is an online learning platform that connects learners, educators, and institutions with the goal of providing educational content that is affordable, accessible, and relevant. It combines content, data, and technology into a single, unified platform that is customizable and extensible to both individual learners and institutions. The company operates through three reporting segments: Consumer, Enterprise, and Degrees. The majority of revenue is generated from the Consumer segment. The consumer segment targets individual learners seeking to obtain hands-on learning, gain valuable job skills, receive professional-level certifications, and otherwise increase their knowledge to start or advance their careers.
A Deep Dive into Coursera's Financials
Market Capitalization Analysis: Reflecting a smaller scale, the company's market capitalization is positioned below industry averages. This could be attributed to factors such as growth expectations or operational capacity.
Revenue Growth: Coursera's revenue growth over a period of 3M has been noteworthy. As of 31 December, 2024, the company achieved a revenue growth rate of approximately 6.1%. This indicates a substantial increase in the company's top-line earnings. In comparison to its industry peers, the company trails behind with a growth rate lower than the average among peers in the Consumer Discretionary sector.
Net Margin: Coursera's net margin is below industry standards, pointing towards difficulties in achieving strong profitability. With a net margin of -12.06%, the company may encounter challenges in effective cost control.
Return on Equity (ROE): Coursera's ROE lags behind industry averages, suggesting challenges in maximizing returns on equity capital. With an ROE of -3.63%, the company may face hurdles in achieving optimal financial performance.
Return on Assets (ROA): Coursera's ROA is below industry averages, indicating potential challenges in efficiently utilizing assets. With an ROA of -2.34%, the company may face hurdles in achieving optimal financial returns.
Debt Management: Coursera's debt-to-equity ratio is below the industry average at 0.01, reflecting a lower dependency on debt financing and a more conservative financial approach.
How Are Analyst Ratings Determined?
Analysts are specialists within banking and financial systems that typically report for specific stocks or within defined sectors. These people research company financial statements, sit in conference calls and meetings, and speak with relevant insiders to determine what are known as analyst ratings for stocks. Typically, analysts will rate each stock once a quarter.
In addition to their assessments, some analysts extend their insights by offering predictions for key metrics such as earnings, revenue, and growth estimates. This supplementary information provides further guidance for traders. It is crucial to recognize that, despite their specialization, analysts are human and can only provide forecasts based on their beliefs.
Which Stocks Are Analysts Recommending Now?
Benzinga Edge gives you instant access to all major analyst upgrades, downgrades, and price targets. Sort by accuracy, upside potential, and more. Click here to stay ahead of the market.
This article was generated by Benzinga's automated content engine and reviewed by an editor.
Edge Rankings
Price Trend
© 2025 Benzinga.com. Benzinga does not provide investment advice. All rights reserved.
date | ticker | name | Price Target | Upside/Downside | Recommendation | Firm |
|---|
Trade confidently with insights and alerts from analyst ratings, free reports and breaking news that affects the stocks you care about.

