


Providing a diverse range of perspectives from bullish to bearish, 9 analysts have published ratings on SPS Commerce SPSC in the last three months.
The table below provides a concise overview of recent ratings by analysts, offering insights into the changing sentiments over the past 30 days and drawing comparisons with the preceding months for a holistic perspective.
| Bullish | Somewhat Bullish | Indifferent | Somewhat Bearish | Bearish | |
|---|---|---|---|---|---|
| Total Ratings | 6 | 0 | 3 | 0 | 0 |
| Last 30D | 1 | 0 | 0 | 0 | 0 |
| 1M Ago | 2 | 0 | 0 | 0 | 0 |
| 2M Ago | 0 | 0 | 0 | 0 | 0 |
| 3M Ago | 3 | 0 | 3 | 0 | 0 |
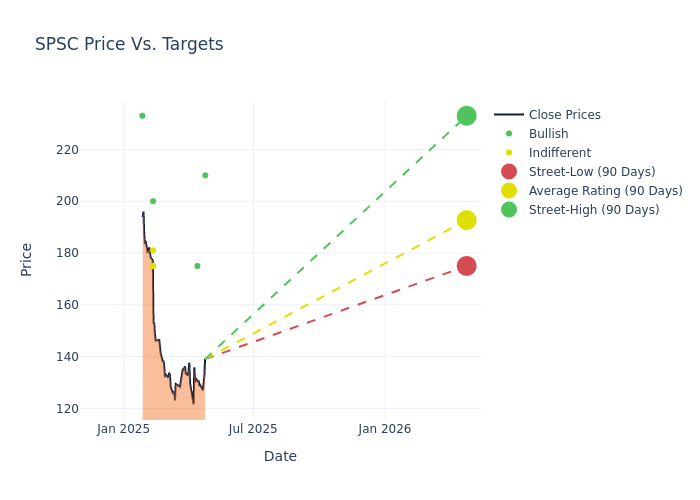
The 12-month price targets, analyzed by analysts, offer insights with an average target of $196.56, a high estimate of $233.00, and a low estimate of $175.00. Experiencing a 9.37% decline, the current average is now lower than the previous average price target of $216.89.
Understanding Analyst Ratings: A Comprehensive Breakdown
The standing of SPS Commerce among financial experts becomes clear with a thorough analysis of recent analyst actions. The summary below outlines key analysts, their recent evaluations, and adjustments to ratings and price targets.
| Analyst | Analyst Firm | Action Taken | Rating |Current Price Target| Prior Price Target | |--------------------|-------------------------|---------------|---------------|--------------------|--------------------| |Scott Berg |Needham |Maintains |Buy | $210.00|$210.00 | |Gil Luria |DA Davidson |Lowers |Buy | $175.00|$245.00 | |Scott Berg |Needham |Maintains |Buy | $210.00|$210.00 | |Parker Lane |Stifel |Lowers |Buy | $200.00|$225.00 | |Joe Vruwink |Baird |Lowers |Neutral | $175.00|$188.00 | |Quinton Gabrielli |Piper Sandler |Lowers |Neutral | $175.00|$198.00 | |Nehal Chokshi |Northland Capital Markets|Lowers |Market Perform | $181.00|$209.00 | |Scott Berg |Needham |Lowers |Buy | $210.00|$230.00 | |George Kurosawa |Citigroup |Lowers |Buy | $233.00|$237.00 |
Key Insights:
- Action Taken: Analysts respond to changes in market conditions and company performance, frequently updating their recommendations. Whether they 'Maintain', 'Raise' or 'Lower' their stance, it reflects their reaction to recent developments related to SPS Commerce. This information offers a snapshot of how analysts perceive the current state of the company.
- Rating: Analyzing trends, analysts offer qualitative evaluations, ranging from 'Outperform' to 'Underperform'. These ratings convey expectations for the relative performance of SPS Commerce compared to the broader market.
- Price Targets: Delving into movements, analysts provide estimates for the future value of SPS Commerce's stock. This analysis reveals shifts in analysts' expectations over time.
To gain a panoramic view of SPS Commerce's market performance, explore these analyst evaluations alongside essential financial indicators. Stay informed and make judicious decisions using our Ratings Table.
Stay up to date on SPS Commerce analyst ratings.
Discovering SPS Commerce: A Closer Look
SPS Commerce Inc is a provider of cloud-based supply chain management services for retailers, grocers, distributors, suppliers, and logistics firms to increase supply chain performance, optimize inventory levels and sell-through, reduce operational costs, improve order visibility, and satisfy consumer demands for a seamless omnichannel experience. Its solutions are delivered through the SPS Commerce platform and provide integrations and retail performance analytics to its customers. Its products are; Fulfillment, Analytics, and Other products like Assortment and Community also it provides one-time services such as professional services and testing and certification. The group derives revenue from subscription-based recurring revenue services.
Unraveling the Financial Story of SPS Commerce
Market Capitalization Analysis: Positioned below industry benchmarks, the company's market capitalization faces constraints in size. This could be influenced by factors such as growth expectations or operational capacity.
Positive Revenue Trend: Examining SPS Commerce's financials over 3M reveals a positive narrative. The company achieved a noteworthy revenue growth rate of 17.9% as of 31 December, 2024, showcasing a substantial increase in top-line earnings. As compared to its peers, the revenue growth lags behind its industry peers. The company achieved a growth rate lower than the average among peers in Information Technology sector.
Net Margin: The company's net margin is a standout performer, exceeding industry averages. With an impressive net margin of 10.27%, the company showcases strong profitability and effective cost control.
Return on Equity (ROE): SPS Commerce's financial strength is reflected in its exceptional ROE, which exceeds industry averages. With a remarkable ROE of 2.09%, the company showcases efficient use of equity capital and strong financial health.
Return on Assets (ROA): SPS Commerce's financial strength is reflected in its exceptional ROA, which exceeds industry averages. With a remarkable ROA of 1.73%, the company showcases efficient use of assets and strong financial health.
Debt Management: SPS Commerce's debt-to-equity ratio is below industry norms, indicating a sound financial structure with a ratio of 0.01.
The Basics of Analyst Ratings
Ratings come from analysts, or specialists within banking and financial systems that report for specific stocks or defined sectors (typically once per quarter for each stock). Analysts usually derive their information from company conference calls and meetings, financial statements, and conversations with important insiders to reach their decisions.
In addition to their assessments, some analysts extend their insights by offering predictions for key metrics such as earnings, revenue, and growth estimates. This supplementary information provides further guidance for traders. It is crucial to recognize that, despite their specialization, analysts are human and can only provide forecasts based on their beliefs.
Which Stocks Are Analysts Recommending Now?
Benzinga Edge gives you instant access to all major analyst upgrades, downgrades, and price targets. Sort by accuracy, upside potential, and more. Click here to stay ahead of the market.
This article was generated by Benzinga's automated content engine and reviewed by an editor.
Edge Rankings
Price Trend
© 2025 Benzinga.com. Benzinga does not provide investment advice. All rights reserved.
date | ticker | name | Price Target | Upside/Downside | Recommendation | Firm |
|---|
Trade confidently with insights and alerts from analyst ratings, free reports and breaking news that affects the stocks you care about.

