


In the preceding three months, 12 analysts have released ratings for The Hartford Insurance Gr HIG, presenting a wide array of perspectives from bullish to bearish.
The table below offers a condensed view of their recent ratings, showcasing the changing sentiments over the past 30 days and comparing them to the preceding months.
| Bullish | Somewhat Bullish | Indifferent | Somewhat Bearish | Bearish | |
|---|---|---|---|---|---|
| Total Ratings | 0 | 9 | 3 | 0 | 0 |
| Last 30D | 0 | 1 | 0 | 0 | 0 |
| 1M Ago | 0 | 5 | 2 | 0 | 0 |
| 2M Ago | 0 | 0 | 0 | 0 | 0 |
| 3M Ago | 0 | 3 | 1 | 0 | 0 |
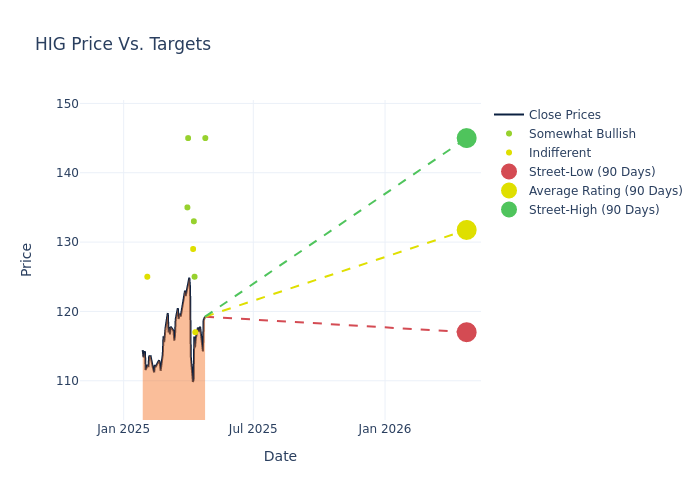
Analysts have set 12-month price targets for The Hartford Insurance Gr, revealing an average target of $132.5, a high estimate of $145.00, and a low estimate of $117.00. This upward trend is apparent, with the current average reflecting a 1.92% increase from the previous average price target of $130.00.
Exploring Analyst Ratings: An In-Depth Overview
In examining recent analyst actions, we gain insights into how financial experts perceive The Hartford Insurance Gr. The following summary outlines key analysts, their recent evaluations, and adjustments to ratings and price targets.
| Analyst | Analyst Firm | Action Taken | Rating |Current Price Target| Prior Price Target | |--------------------|-----------------------|---------------|---------------|--------------------|--------------------| |Alex Scott |Barclays |Raises |Overweight | $145.00|$140.00 | |Alex Scott |Barclays |Raises |Overweight | $140.00|$135.00 | |Yaron Kinar |Jefferies |Lowers |Hold | $117.00|$118.00 | |Elyse Greenspan |Wells Fargo |Lowers |Overweight | $125.00|$126.00 | |Meyer Shields |Keefe, Bruyette & Woods|Lowers |Outperform | $133.00|$140.00 | |Jimmy Bhullar |JP Morgan |Raises |Neutral | $129.00|$125.00 | |Paul Newsome |Piper Sandler |Raises |Overweight | $145.00|$130.00 | |C. Gregory Peters |Raymond James |Raises |Outperform | $135.00|$125.00 | |Meyer Shields |Keefe, Bruyette & Woods|Raises |Outperform | $140.00|$139.00 | |Scott Heleniak |RBC Capital |Maintains |Sector Perform | $125.00|$125.00 | |Paul Newsome |Piper Sandler |Raises |Overweight | $130.00|$127.00 | |Elyse Greenspan |Wells Fargo |Lowers |Overweight | $126.00|$130.00 |
Key Insights:
- Action Taken: In response to dynamic market conditions and company performance, analysts update their recommendations. Whether they 'Maintain', 'Raise', or 'Lower' their stance, it signifies their reaction to recent developments related to The Hartford Insurance Gr. This insight gives a snapshot of analysts' perspectives on the current state of the company.
- Rating: Analysts assign qualitative assessments to stocks, ranging from 'Outperform' to 'Underperform'. These ratings convey the analysts' expectations for the relative performance of The Hartford Insurance Gr compared to the broader market.
- Price Targets: Analysts explore the dynamics of price targets, providing estimates for the future value of The Hartford Insurance Gr's stock. This examination reveals shifts in analysts' expectations over time.
Analyzing these analyst evaluations alongside relevant financial metrics can provide a comprehensive view of The Hartford Insurance Gr's market position. Stay informed and make data-driven decisions with the assistance of our Ratings Table.
Stay up to date on The Hartford Insurance Gr analyst ratings.
About The Hartford Insurance Gr
The Hartford Insurance Group Inc. provides property and casualty insurance, group benefits, and mutual funds. The company is widely recognized for its service excellence, sustainability practices, trust, and integrity. The Company currently conducts business principally in five reportable segments including Business Insurance, Personal Insurance, Property & Casualty Other Operations, Employee Benefits, and Hartford Funds, as well as a Corporate category. The company generates a majority of its revenue from Business Insurance.
Key Indicators: The Hartford Insurance Gr's Financial Health
Market Capitalization: Surpassing industry standards, the company's market capitalization asserts its dominance in terms of size, suggesting a robust market position.
Revenue Growth: The Hartford Insurance Gr's remarkable performance in 3M is evident. As of 31 December, 2024, the company achieved an impressive revenue growth rate of 7.54%. This signifies a substantial increase in the company's top-line earnings. When compared to others in the Financials sector, the company excelled with a growth rate higher than the average among peers.
Net Margin: The company's net margin is a standout performer, exceeding industry averages. With an impressive net margin of 12.47%, the company showcases strong profitability and effective cost control.
Return on Equity (ROE): The company's ROE is a standout performer, exceeding industry averages. With an impressive ROE of 5.17%, the company showcases effective utilization of equity capital.
Return on Assets (ROA): The Hartford Insurance Gr's ROA stands out, surpassing industry averages. With an impressive ROA of 1.05%, the company demonstrates effective utilization of assets and strong financial performance.
Debt Management: With a below-average debt-to-equity ratio of 0.27, The Hartford Insurance Gr adopts a prudent financial strategy, indicating a balanced approach to debt management.
The Basics of Analyst Ratings
Analysts are specialists within banking and financial systems that typically report for specific stocks or within defined sectors. These people research company financial statements, sit in conference calls and meetings, and speak with relevant insiders to determine what are known as analyst ratings for stocks. Typically, analysts will rate each stock once a quarter.
Some analysts publish their predictions for metrics such as growth estimates, earnings, and revenue to provide additional guidance with their ratings. When using analyst ratings, it is important to keep in mind that stock and sector analysts are also human and are only offering their opinions to investors.
Which Stocks Are Analysts Recommending Now?
Benzinga Edge gives you instant access to all major analyst upgrades, downgrades, and price targets. Sort by accuracy, upside potential, and more. Click here to stay ahead of the market.
This article was generated by Benzinga's automated content engine and reviewed by an editor.
Edge Rankings
Price Trend
© 2025 Benzinga.com. Benzinga does not provide investment advice. All rights reserved.
date | ticker | name | Price Target | Upside/Downside | Recommendation | Firm |
|---|
Trade confidently with insights and alerts from analyst ratings, free reports and breaking news that affects the stocks you care about.

