


In the last three months, 10 analysts have published ratings on PTC PTC, offering a diverse range of perspectives from bullish to bearish.
The following table encapsulates their recent ratings, offering a glimpse into the evolving sentiments over the past 30 days and comparing them to the preceding months.
| Bullish | Somewhat Bullish | Indifferent | Somewhat Bearish | Bearish | |
|---|---|---|---|---|---|
| Total Ratings | 2 | 5 | 3 | 0 | 0 |
| Last 30D | 0 | 1 | 0 | 0 | 0 |
| 1M Ago | 0 | 3 | 2 | 0 | 0 |
| 2M Ago | 0 | 0 | 0 | 0 | 0 |
| 3M Ago | 2 | 1 | 1 | 0 | 0 |
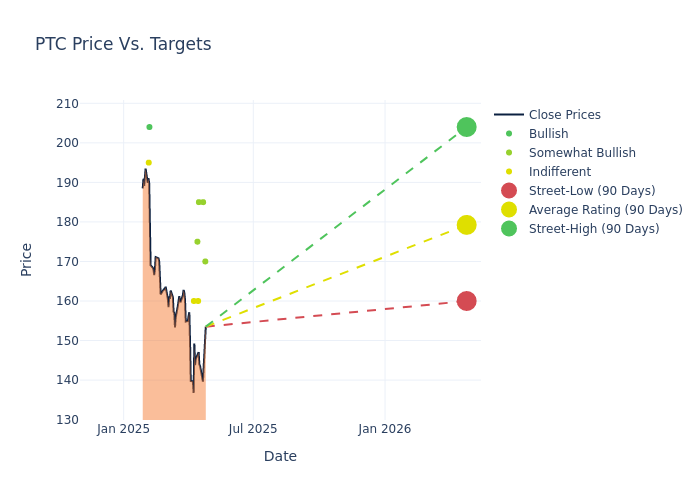
Analysts provide deeper insights through their assessments of 12-month price targets, revealing an average target of $184.9, a high estimate of $211.00, and a low estimate of $160.00. This current average represents a 8.92% decrease from the previous average price target of $203.00.
Interpreting Analyst Ratings: A Closer Look
An in-depth analysis of recent analyst actions unveils how financial experts perceive PTC. The following summary outlines key analysts, their recent evaluations, and adjustments to ratings and price targets.
| Analyst | Analyst Firm | Action Taken | Rating |Current Price Target| Prior Price Target | |--------------------|--------------------|---------------|---------------|--------------------|--------------------| |Ken Wong |Oppenheimer |Lowers |Outperform | $170.00|$210.00 | |Joe Vruwink |Baird |Raises |Outperform | $185.00|$181.00 | |Jason Celino |Keybanc |Lowers |Overweight | $185.00|$211.00 | |Matthew Broome |Mizuho |Lowers |Neutral | $160.00|$190.00 | |Saket Kalia |Barclays |Lowers |Overweight | $175.00|$215.00 | |Alexei Gogolev |JP Morgan |Lowers |Neutral | $160.00|$210.00 | |John Vinh |Keybanc |Raises |Overweight | $211.00|$205.00 | |Blair Abernethy |Rosenblatt |Maintains |Buy | $204.00|$204.00 | |Tyler Radke |Citigroup |Lowers |Neutral | $195.00|$200.00 | |Blair Abernethy |Rosenblatt |Maintains |Buy | $204.00|$204.00 |
Key Insights:
- Action Taken: Responding to changing market dynamics and company performance, analysts update their recommendations. Whether they 'Maintain', 'Raise', or 'Lower' their stance, it signifies their response to recent developments related to PTC. This offers insight into analysts' perspectives on the current state of the company.
- Rating: Gaining insights, analysts provide qualitative assessments, ranging from 'Outperform' to 'Underperform'. These ratings reflect expectations for the relative performance of PTC compared to the broader market.
- Price Targets: Analysts explore the dynamics of price targets, providing estimates for the future value of PTC's stock. This examination reveals shifts in analysts' expectations over time.
To gain a panoramic view of PTC's market performance, explore these analyst evaluations alongside essential financial indicators. Stay informed and make judicious decisions using our Ratings Table.
Stay up to date on PTC analyst ratings.
About PTC
PTC offers high-end computer-assisted design (Creo) and product lifecycle management (Windchill) software as well as Internet of Things and AR industrial solutions. Founded in 1985, PTC has 28,000 customers, with revenue stemming mostly from North America and Europe.
Breaking Down PTC's Financial Performance
Market Capitalization Analysis: Positioned below industry benchmarks, the company's market capitalization faces constraints in size. This could be influenced by factors such as growth expectations or operational capacity.
Positive Revenue Trend: Examining PTC's financials over 3M reveals a positive narrative. The company achieved a noteworthy revenue growth rate of 2.71% as of 31 December, 2024, showcasing a substantial increase in top-line earnings. As compared to its peers, the revenue growth lags behind its industry peers. The company achieved a growth rate lower than the average among peers in Information Technology sector.
Net Margin: PTC's financial strength is reflected in its exceptional net margin, which exceeds industry averages. With a remarkable net margin of 14.55%, the company showcases strong profitability and effective cost management.
Return on Equity (ROE): PTC's ROE lags behind industry averages, suggesting challenges in maximizing returns on equity capital. With an ROE of 2.55%, the company may face hurdles in achieving optimal financial performance.
Return on Assets (ROA): The company's ROA is below industry benchmarks, signaling potential difficulties in efficiently utilizing assets. With an ROA of 1.32%, the company may need to address challenges in generating satisfactory returns from its assets.
Debt Management: PTC's debt-to-equity ratio stands notably higher than the industry average, reaching 0.53. This indicates a heavier reliance on borrowed funds, raising concerns about financial leverage.
What Are Analyst Ratings?
Experts in banking and financial systems, analysts specialize in reporting for specific stocks or defined sectors. Their comprehensive research involves attending company conference calls and meetings, analyzing financial statements, and engaging with insiders to generate what are known as analyst ratings for stocks. Typically, analysts assess and rate each stock once per quarter.
Some analysts will also offer forecasts for metrics like growth estimates, earnings, and revenue to provide further guidance on stocks. Investors who use analyst ratings should note that this specialized advice comes from humans and may be subject to error.
Breaking: Wall Street's Next Big Mover
Benzinga's #1 analyst just identified a stock poised for explosive growth. This under-the-radar company could surge 200%+ as major market shifts unfold. Click here for urgent details.
This article was generated by Benzinga's automated content engine and reviewed by an editor.
Edge Rankings
Price Trend
© 2025 Benzinga.com. Benzinga does not provide investment advice. All rights reserved.
date | ticker | name | Price Target | Upside/Downside | Recommendation | Firm |
|---|
Trade confidently with insights and alerts from analyst ratings, free reports and breaking news that affects the stocks you care about.

