


In the last three months, 5 analysts have published ratings on Webster Financial WBS, offering a diverse range of perspectives from bullish to bearish.
The table below provides a concise overview of recent ratings by analysts, offering insights into the changing sentiments over the past 30 days and drawing comparisons with the preceding months for a holistic perspective.
| Bullish | Somewhat Bullish | Indifferent | Somewhat Bearish | Bearish | |
|---|---|---|---|---|---|
| Total Ratings | 0 | 4 | 1 | 0 | 0 |
| Last 30D | 0 | 1 | 0 | 0 | 0 |
| 1M Ago | 0 | 3 | 0 | 0 | 0 |
| 2M Ago | 0 | 0 | 1 | 0 | 0 |
| 3M Ago | 0 | 0 | 0 | 0 | 0 |
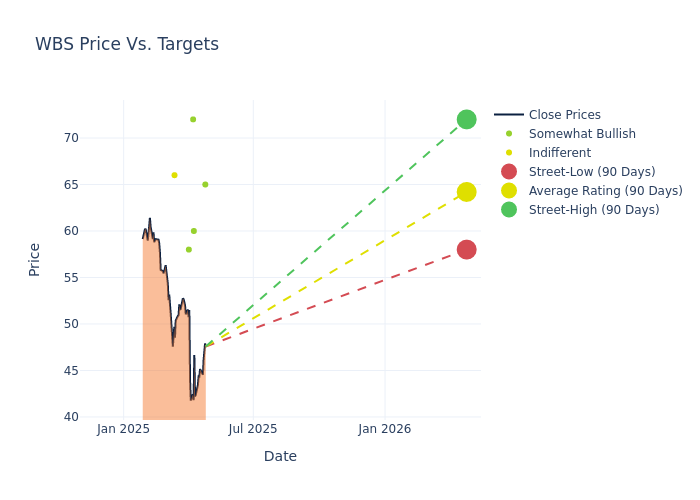
Providing deeper insights, analysts have established 12-month price targets, indicating an average target of $64.2, along with a high estimate of $72.00 and a low estimate of $58.00. This current average has decreased by 12.05% from the previous average price target of $73.00.
Deciphering Analyst Ratings: An In-Depth Analysis
In examining recent analyst actions, we gain insights into how financial experts perceive Webster Financial. The following summary outlines key analysts, their recent evaluations, and adjustments to ratings and price targets.
| Analyst | Analyst Firm | Action Taken | Rating |Current Price Target| Prior Price Target | |--------------------|-----------------------|---------------|---------------|--------------------|--------------------| |Christopher Mcgratty|Keefe, Bruyette & Woods|Lowers |Outperform | $65.00|$70.00 | |Timur Braziler |Wells Fargo |Lowers |Overweight | $60.00|$75.00 | |Jared Shaw |Barclays |Lowers |Overweight | $72.00|$80.00 | |Daniel Tamayo |Raymond James |Lowers |Outperform | $58.00|$65.00 | |Manan Gosalia |Morgan Stanley |Lowers |Equal-Weight | $66.00|$75.00 |
Key Insights:
- Action Taken: Analysts frequently update their recommendations based on evolving market conditions and company performance. Whether they 'Maintain', 'Raise' or 'Lower' their stance, it reflects their reaction to recent developments related to Webster Financial. This information provides a snapshot of how analysts perceive the current state of the company.
- Rating: Analysts assign qualitative assessments to stocks, ranging from 'Outperform' to 'Underperform'. These ratings convey the analysts' expectations for the relative performance of Webster Financial compared to the broader market.
- Price Targets: Gaining insights, analysts provide estimates for the future value of Webster Financial's stock. This comparison reveals trends in analysts' expectations over time.
Assessing these analyst evaluations alongside crucial financial indicators can provide a comprehensive overview of Webster Financial's market position. Stay informed and make well-judged decisions with the assistance of our Ratings Table.
Stay up to date on Webster Financial analyst ratings.
All You Need to Know About Webster Financial
Webster Financial Corp is a full-service provider of financial services, offering commercial and consumer banking, mortgages, and investment advisory along with trust and wealth management services in Connecticut, New York, Rhode Island, Massachusetts, and Pennsylvania. The company's segment includes Commercial Banking, HSA Bank, and Consumer Banking. It generates maximum revenue from the Commercial Banking segment.
Webster Financial: Delving into Financials
Market Capitalization Analysis: Below industry benchmarks, the company's market capitalization reflects a smaller scale relative to peers. This could be attributed to factors such as growth expectations or operational capacity.
Revenue Growth: Webster Financial's remarkable performance in 3M is evident. As of 31 December, 2024, the company achieved an impressive revenue growth rate of 4.12%. This signifies a substantial increase in the company's top-line earnings. In comparison to its industry peers, the company trails behind with a growth rate lower than the average among peers in the Financials sector.
Net Margin: Webster Financial's net margin lags behind industry averages, suggesting challenges in maintaining strong profitability. With a net margin of 25.99%, the company may face hurdles in effective cost management.
Return on Equity (ROE): Webster Financial's ROE is below industry averages, indicating potential challenges in efficiently utilizing equity capital. With an ROE of 1.93%, the company may face hurdles in achieving optimal financial returns.
Return on Assets (ROA): The company's ROA is below industry benchmarks, signaling potential difficulties in efficiently utilizing assets. With an ROA of 0.22%, the company may need to address challenges in generating satisfactory returns from its assets.
Debt Management: With a below-average debt-to-equity ratio of 0.34, Webster Financial adopts a prudent financial strategy, indicating a balanced approach to debt management.
The Significance of Analyst Ratings Explained
Analysts work in banking and financial systems and typically specialize in reporting for stocks or defined sectors. Analysts may attend company conference calls and meetings, research company financial statements, and communicate with insiders to publish "analyst ratings" for stocks. Analysts typically rate each stock once per quarter.
Some analysts publish their predictions for metrics such as growth estimates, earnings, and revenue to provide additional guidance with their ratings. When using analyst ratings, it is important to keep in mind that stock and sector analysts are also human and are only offering their opinions to investors.
If you want to keep track of which analysts are outperforming others, you can view updated analyst ratings along withanalyst success scores in Benzinga Pro.
Which Stocks Are Analysts Recommending Now?
Benzinga Edge gives you instant access to all major analyst upgrades, downgrades, and price targets. Sort by accuracy, upside potential, and more. Click here to stay ahead of the market.
This article was generated by Benzinga's automated content engine and reviewed by an editor.
Edge Rankings
Price Trend
© 2025 Benzinga.com. Benzinga does not provide investment advice. All rights reserved.
date | ticker | name | Price Target | Upside/Downside | Recommendation | Firm |
|---|
Trade confidently with insights and alerts from analyst ratings, free reports and breaking news that affects the stocks you care about.

