


Preferred Bank PFBC underwent analysis by 4 analysts in the last quarter, revealing a spectrum of viewpoints from bullish to bearish.
Summarizing their recent assessments, the table below illustrates the evolving sentiments in the past 30 days and compares them to the preceding months.
| Bullish | Somewhat Bullish | Indifferent | Somewhat Bearish | Bearish | |
|---|---|---|---|---|---|
| Total Ratings | 0 | 1 | 3 | 0 | 0 |
| Last 30D | 0 | 0 | 1 | 0 | 0 |
| 1M Ago | 0 | 0 | 0 | 0 | 0 |
| 2M Ago | 0 | 0 | 0 | 0 | 0 |
| 3M Ago | 0 | 1 | 2 | 0 | 0 |
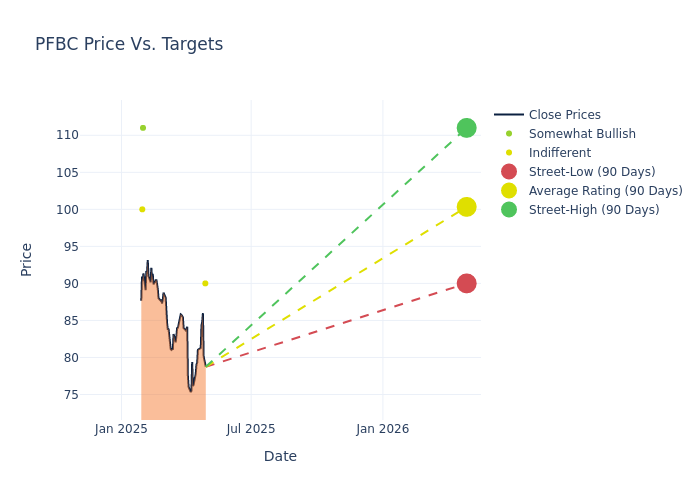
Insights from analysts' 12-month price targets are revealed, presenting an average target of $100.5, a high estimate of $111.00, and a low estimate of $90.00. This current average has increased by 2.03% from the previous average price target of $98.50.
Interpreting Analyst Ratings: A Closer Look
A clear picture of Preferred Bank's perception among financial experts is painted with a thorough analysis of recent analyst actions. The summary below outlines key analysts, their recent evaluations, and adjustments to ratings and price targets.
| Analyst | Analyst Firm | Action Taken | Rating |Current Price Target| Prior Price Target | |--------------------|--------------------|---------------|---------------|--------------------|--------------------| |Gary Tenner |DA Davidson |Lowers |Neutral | $90.00|$95.00 | |Matthew Clark |Piper Sandler |Raises |Overweight | $111.00|$101.00 | |Andrew Terrell |Stephens & Co. |Maintains |Equal-Weight | $100.00|$100.00 | |Gary Tenner |DA Davidson |Raises |Neutral | $101.00|$98.00 |
Key Insights:
- Action Taken: Analysts frequently update their recommendations based on evolving market conditions and company performance. Whether they 'Maintain', 'Raise' or 'Lower' their stance, it reflects their reaction to recent developments related to Preferred Bank. This information provides a snapshot of how analysts perceive the current state of the company.
- Rating: Offering insights into predictions, analysts assign qualitative values, from 'Outperform' to 'Underperform'. These ratings convey expectations for the relative performance of Preferred Bank compared to the broader market.
- Price Targets: Analysts set price targets as an estimate of a stock's future value. Comparing the current and prior price targets provides insight into how analysts' expectations have changed over time. This information can be valuable for investors seeking to understand consensus views on the stock's potential future performance.
Capture valuable insights into Preferred Bank's market standing by understanding these analyst evaluations alongside pertinent financial indicators. Stay informed and make strategic decisions with our Ratings Table.
Stay up to date on Preferred Bank analyst ratings.
If you are interested in following small-cap stock news and performance you can start by tracking it here.
Unveiling the Story Behind Preferred Bank
Preferred Bank is a commercial bank located in California. Its products and services are divided into Personal Banking, Business Banking, and Commercial Banking which includes Checking accounts, Savings accounts, CDs, Loans and Credit, Electronic banking, and Treasury Management. It provides personalized deposit services, real estate finance, commercial loans, and trade finance credit facilities to small and mid-sized businesses and their owners, entrepreneurs, real estate developers and investors, professionals, and high-net-worth individuals. The bank generates a majority of its revenue from Southern and Northern California and Flushing.
Breaking Down Preferred Bank's Financial Performance
Market Capitalization: Positioned above industry average, the company's market capitalization underscores its superiority in size, indicative of a strong market presence.
Revenue Growth: Preferred Bank displayed positive results in 3M. As of 31 December, 2024, the company achieved a solid revenue growth rate of approximately 3.55%. This indicates a notable increase in the company's top-line earnings. In comparison to its industry peers, the company trails behind with a growth rate lower than the average among peers in the Financials sector.
Net Margin: The company's net margin is a standout performer, exceeding industry averages. With an impressive net margin of 42.82%, the company showcases strong profitability and effective cost control.
Return on Equity (ROE): Preferred Bank's ROE excels beyond industry benchmarks, reaching 3.99%. This signifies robust financial management and efficient use of shareholder equity capital.
Return on Assets (ROA): Preferred Bank's ROA stands out, surpassing industry averages. With an impressive ROA of 0.44%, the company demonstrates effective utilization of assets and strong financial performance.
Debt Management: Preferred Bank's debt-to-equity ratio is below industry norms, indicating a sound financial structure with a ratio of 0.22.
The Core of Analyst Ratings: What Every Investor Should Know
Analysts work in banking and financial systems and typically specialize in reporting for stocks or defined sectors. Analysts may attend company conference calls and meetings, research company financial statements, and communicate with insiders to publish "analyst ratings" for stocks. Analysts typically rate each stock once per quarter.
In addition to their assessments, some analysts extend their insights by offering predictions for key metrics such as earnings, revenue, and growth estimates. This supplementary information provides further guidance for traders. It is crucial to recognize that, despite their specialization, analysts are human and can only provide forecasts based on their beliefs.
Breaking: Wall Street's Next Big Mover
Benzinga's #1 analyst just identified a stock poised for explosive growth. This under-the-radar company could surge 200%+ as major market shifts unfold. Click here for urgent details.
This article was generated by Benzinga's automated content engine and reviewed by an editor.
Edge Rankings
Price Trend
© 2025 Benzinga.com. Benzinga does not provide investment advice. All rights reserved.
date | ticker | name | Price Target | Upside/Downside | Recommendation | Firm |
|---|
Trade confidently with insights and alerts from analyst ratings, free reports and breaking news that affects the stocks you care about.

