


Goldman Sachs Gr GS is set to give its latest quarterly earnings report on Monday, 2025-04-14. Here's what investors need to know before the announcement.
Analysts estimate that Goldman Sachs Gr will report an earnings per share (EPS) of $12.27.
The market awaits Goldman Sachs Gr's announcement, with hopes high for news of surpassing estimates and providing upbeat guidance for the next quarter.
It's important for new investors to understand that guidance can be a significant driver of stock prices.
Overview of Past Earnings
The company's EPS beat by $3.73 in the last quarter, leading to a 1.17% increase in the share price on the following day.
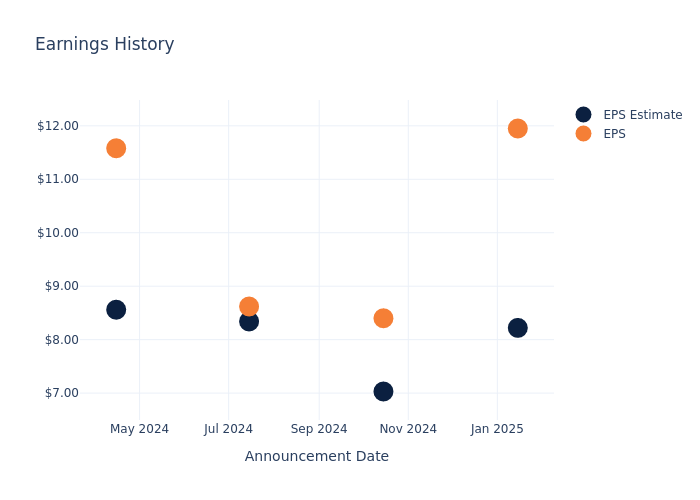
Here's a look at Goldman Sachs Gr's past performance and the resulting price change:
| Quarter | Q4 2024 | Q3 2024 | Q2 2024 | Q1 2024 |
|---|---|---|---|---|
| EPS Estimate | 8.22 | 7.03 | 8.34 | 8.56 |
| EPS Actual | 11.95 | 8.40 | 8.62 | 11.58 |
| Price Change % | 1.0% | 1.0% | 2.0% | -1.0% |
Tracking Goldman Sachs Gr's Stock Performance
Shares of Goldman Sachs Gr were trading at $489.8 as of April 10. Over the last 52-week period, shares are up 22.29%. Given that these returns are generally positive, long-term shareholders are likely bullish going into this earnings release.
Insights Shared by Analysts on Goldman Sachs Gr
For investors, grasping market sentiments and expectations in the industry is vital. This analysis explores the latest insights regarding Goldman Sachs Gr.
A total of 13 analyst ratings have been received for Goldman Sachs Gr, with the consensus rating being Outperform. The average one-year price target stands at $655.31, suggesting a potential 33.79% upside.
Comparing Ratings Among Industry Peers
The below comparison of the analyst ratings and average 1-year price targets of LPL Finl Hldgs, Interactive Brokers Group and Houlihan Lokey, three prominent players in the industry, gives insights for their relative performance expectations and market positioning.
- Analysts currently favor an Outperform trajectory for LPL Finl Hldgs, with an average 1-year price target of $400.25, suggesting a potential 18.28% downside.
- Analysts currently favor an Outperform trajectory for Interactive Brokers Group, with an average 1-year price target of $215.0, suggesting a potential 56.1% downside.
- Analysts currently favor an Outperform trajectory for Houlihan Lokey, with an average 1-year price target of $183.18, suggesting a potential 62.6% downside.
Insights: Peer Analysis
The peer analysis summary provides a snapshot of key metrics for LPL Finl Hldgs, Interactive Brokers Group and Houlihan Lokey, illuminating their respective standings within the industry. These metrics offer valuable insights into their market positions and comparative performance.
| Company | Consensus | Revenue Growth | Gross Profit | Return on Equity |
|---|---|---|---|---|
| Robinhood Markets | Outperform | 115.29% | $870M | 12.07% |
| LPL Finl Hldgs | Outperform | 32.85% | $905.20M | 9.50% |
| Interactive Brokers Group | Outperform | 15.40% | $2.17B | 5.15% |
| Houlihan Lokey | Outperform | 24.12% | $244.25M | 4.72% |
Key Takeaway:
Goldman Sachs Gr ranks at the top for Gross Profit and Return on Equity among its peers. In terms of Revenue Growth, it is in the middle compared to others. Overall, Goldman Sachs Gr is performing well in key financial metrics when compared to its peers in the financial services industry.
Discovering Goldman Sachs Gr: A Closer Look
Goldman Sachs is a leading global investment banking and asset management firm. Approximately 14% of its revenue comes from investment banking, 42% from trading, 20% from asset & wealth management, 15% from net interest income, and 9% from other principal transactions. Around 64% of the company's net revenue is generated in the Americas, 13% in Asia, and 23% in Europe, the Middle East, and Africa.
Financial Insights: Goldman Sachs Gr
Market Capitalization: Boasting an elevated market capitalization, the company surpasses industry averages. This signals substantial size and strong market recognition.
Revenue Growth: Goldman Sachs Gr's remarkable performance in 3 months is evident. As of 31 December, 2024, the company achieved an impressive revenue growth rate of 22.54%. This signifies a substantial increase in the company's top-line earnings. As compared to its peers, the revenue growth lags behind its industry peers. The company achieved a growth rate lower than the average among peers in Financials sector.
Net Margin: Goldman Sachs Gr's net margin surpasses industry standards, highlighting the company's exceptional financial performance. With an impressive 28.29% net margin, the company effectively manages costs and achieves strong profitability.
Return on Equity (ROE): Goldman Sachs Gr's ROE is below industry averages, indicating potential challenges in efficiently utilizing equity capital. With an ROE of 3.62%, the company may face hurdles in achieving optimal financial returns.
Return on Assets (ROA): Goldman Sachs Gr's ROA lags behind industry averages, suggesting challenges in maximizing returns from its assets. With an ROA of 0.23%, the company may face hurdles in achieving optimal financial performance.
Debt Management: Goldman Sachs Gr's debt-to-equity ratio stands notably higher than the industry average, reaching 3.15. This indicates a heavier reliance on borrowed funds, raising concerns about financial leverage.
To track all earnings releases for Goldman Sachs Gr visit their earnings calendar on our site.
This article was generated by Benzinga's automated content engine and reviewed by an editor.
Edge Rankings
Price Trend
© 2025 Benzinga.com. Benzinga does not provide investment advice. All rights reserved.
Trade confidently with insights and alerts from analyst ratings, free reports and breaking news that affects the stocks you care about.

