Blackstone BX will release its quarterly earnings report on Thursday, 2025-04-17. Here's a brief overview for investors ahead of the announcement.
Analysts anticipate Blackstone to report an earnings per share (EPS) of $1.15.
The announcement from Blackstone is eagerly anticipated, with investors seeking news of surpassing estimates and favorable guidance for the next quarter.
It's worth noting for new investors that guidance can be a key determinant of stock price movements.
Performance in Previous Earnings
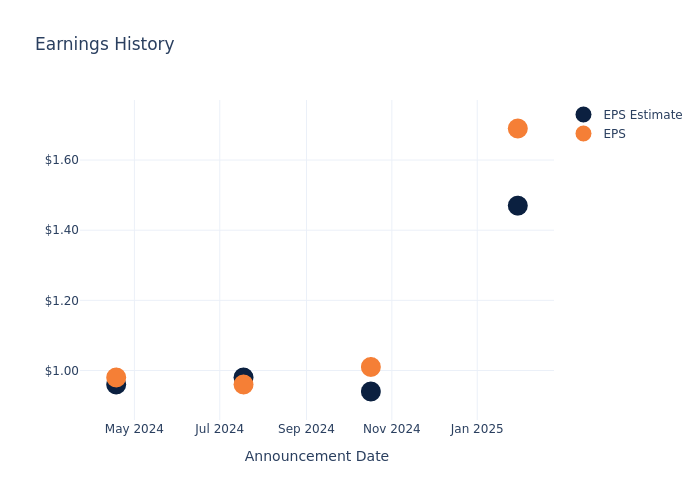
The company's EPS beat by $0.22 in the last quarter, leading to a 0.38% drop in the share price on the following day.
Here's a look at Blackstone's past performance and the resulting price change:
| Quarter | Q4 2024 | Q3 2024 | Q2 2024 | Q1 2024 |
|---|---|---|---|---|
| EPS Estimate | 1.47 | 0.94 | 0.98 | 0.96 |
| EPS Actual | 1.69 | 1.01 | 0.96 | 0.98 |
| Price Change % | -0.0% | 2.0% | 2.0% | -2.0% |

Stock Performance
Shares of Blackstone were trading at $133.54 as of April 15. Over the last 52-week period, shares are up 9.24%. Given that these returns are generally positive, long-term shareholders are likely bullish going into this earnings release.
Analyst Insights on Blackstone
For investors, grasping market sentiments and expectations in the industry is vital. This analysis explores the latest insights regarding Blackstone.
Analysts have given Blackstone a total of 15 ratings, with the consensus rating being Neutral. The average one-year price target is $162.73, indicating a potential 21.86% upside.
Comparing Ratings with Peers
In this comparison, we explore the analyst ratings and average 1-year price targets of Brookfield, Ares Management and T. Rowe Price Group, three prominent industry players, offering insights into their relative performance expectations and market positioning.
- Analysts currently favor an Outperform trajectory for Brookfield, with an average 1-year price target of $70.83, suggesting a potential 46.96% downside.
- Analysts currently favor an Outperform trajectory for Ares Management, with an average 1-year price target of $180.55, suggesting a potential 35.2% upside.
- Analysts currently favor an Neutral trajectory for T. Rowe Price Group, with an average 1-year price target of $97.79, suggesting a potential 26.77% downside.
Peer Metrics Summary
Within the peer analysis summary, vital metrics for Brookfield, Ares Management and T. Rowe Price Group are presented, shedding light on their respective standings within the industry and offering valuable insights into their market positions and comparative performance.
| Company | Consensus | Revenue Growth | Gross Profit | Return on Equity |
|---|---|---|---|---|
| KKR | Outperform | -26.81% | $948.76M | 4.72% |
| Brookfield | Outperform | -20.77% | $5.03B | 0.93% |
| Ares Management | Outperform | 19.45% | $795.93M | -2.05% |
| T. Rowe Price Group | Neutral | 11.11% | $947.60M | 4.16% |
Key Takeaway:
Blackstone ranks at the top for Revenue Growth and Gross Profit among its peers. It is in the middle for Return on Equity.
About Blackstone
Blackstone is the world's largest alternative-asset manager with $1.108 trillion in total asset under management, including $820.5 billion in fee-earning assets under management, at the end of September 2024. The company has four core business segments: private equity (25% of fee-earning AUM and 30% of base management fees), real estate (35% and 39%), credit and insurance (31% and 24%), and multi-asset investing (9% and 7%). While the firm primarily serves institutional investors (87% of AUM), it also caters to clients in the high-net-worth channel (13%). Blackstone operates through 25 offices in the Americas (8), Europe and the Middle East (9), and the Asia-Pacific region (8).
Breaking Down Blackstone's Financial Performance
Market Capitalization: Surpassing industry standards, the company's market capitalization asserts its dominance in terms of size, suggesting a robust market position.
Revenue Growth: Blackstone's revenue growth over a period of 3 months has been noteworthy. As of 31 December, 2024, the company achieved a revenue growth rate of approximately 144.41%. This indicates a substantial increase in the company's top-line earnings. In comparison to its industry peers, the company stands out with a growth rate higher than the average among peers in the Financials sector.
Net Margin: Blackstone's net margin falls below industry averages, indicating challenges in achieving strong profitability. With a net margin of 26.04%, the company may face hurdles in effective cost management.
Return on Equity (ROE): The company's ROE is a standout performer, exceeding industry averages. With an impressive ROE of 9.25%, the company showcases effective utilization of equity capital.
Return on Assets (ROA): Blackstone's ROA surpasses industry standards, highlighting the company's exceptional financial performance. With an impressive 1.64% ROA, the company effectively utilizes its assets for optimal returns.
Debt Management: Blackstone's debt-to-equity ratio is notably higher than the industry average. With a ratio of 1.5, the company relies more heavily on borrowed funds, indicating a higher level of financial risk.
To track all earnings releases for Blackstone visit their earnings calendar on our site.
This article was generated by Benzinga's automated content engine and reviewed by an editor.
Edge Rankings
Price Trend
© 2025 Benzinga.com. Benzinga does not provide investment advice. All rights reserved.
Trade confidently with insights and alerts from analyst ratings, free reports and breaking news that affects the stocks you care about.