


Valmont Industries VMI is set to give its latest quarterly earnings report on Tuesday, 2025-04-22. Here's what investors need to know before the announcement.
Analysts estimate that Valmont Industries will report an earnings per share (EPS) of $4.36.
Investors in Valmont Industries are eagerly awaiting the company's announcement, hoping for news of surpassing estimates and positive guidance for the next quarter.
It's worth noting for new investors that stock prices can be heavily influenced by future projections rather than just past performance.
Performance in Previous Earnings
Last quarter the company beat EPS by $0.22, which was followed by a 2.58% drop in the share price the next day.
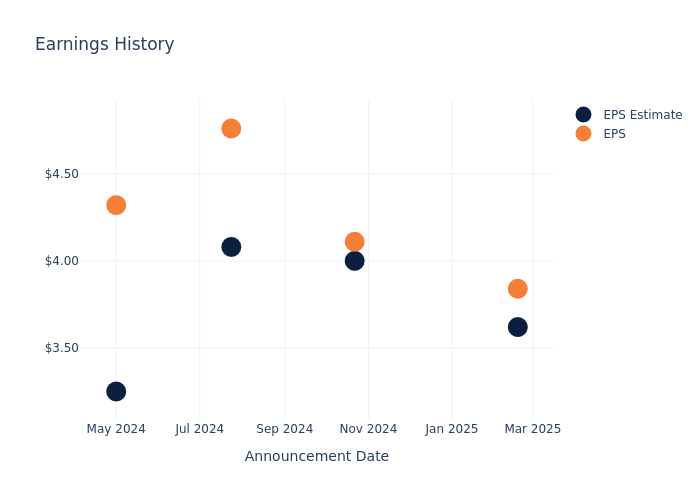
Here's a look at Valmont Industries's past performance and the resulting price change:
| Quarter | Q4 2024 | Q3 2024 | Q2 2024 | Q1 2024 |
|---|---|---|---|---|
| EPS Estimate | 3.62 | 4 | 4.08 | 3.25 |
| EPS Actual | 3.84 | 4.11 | 4.76 | 4.32 |
| Price Change % | -3.0% | 10.0% | 11.0% | 18.0% |
Stock Performance
Shares of Valmont Industries were trading at $277.83 as of April 18. Over the last 52-week period, shares are up 26.72%. Given that these returns are generally positive, long-term shareholders are likely bullish going into this earnings release.
Analysts' Take on Valmont Industries
For investors, grasping market sentiments and expectations in the industry is vital. This analysis explores the latest insights regarding Valmont Industries.
The consensus rating for Valmont Industries is Buy, based on 4 analyst ratings. With an average one-year price target of $383.75, there's a potential 38.12% upside.
Comparing Ratings with Competitors
The following analysis focuses on the analyst ratings and average 1-year price targets of Fluor, Dycom Industries and Construction Partners, three prominent industry players, providing insights into their relative performance expectations and market positioning.
- Analysts currently favor an Buy trajectory for Fluor, with an average 1-year price target of $48.62, suggesting a potential 82.5% downside.
- Analysts currently favor an Outperform trajectory for Dycom Industries, with an average 1-year price target of $199.83, suggesting a potential 28.07% downside.
- Analysts currently favor an Neutral trajectory for Construction Partners, with an average 1-year price target of $98.5, suggesting a potential 64.55% downside.
Snapshot: Peer Analysis
The peer analysis summary offers a detailed examination of key metrics for Fluor, Dycom Industries and Construction Partners, providing valuable insights into their respective standings within the industry and their market positions and comparative performance.
| Company | Consensus | Revenue Growth | Gross Profit | Return on Equity |
|---|---|---|---|---|
| Valmont Industries | Buy | 2.14% | $313.02M | 5.04% |
| Fluor | Buy | 11.52% | $208M | 60.10% |
| Dycom Industries | Outperform | 13.87% | $196.58M | 2.64% |
| Construction Partners | Neutral | 41.63% | $76.57M | -0.44% |
Key Takeaway:
Valmont Industries ranks at the top for Gross Profit and Return on Equity among its peers. It is in the middle for Revenue Growth and below average for Consensus rating.
Discovering Valmont Industries: A Closer Look
Valmont Industries Inc, along with its subsidiaries, operates as a manufacturer of products and services for infrastructure and agriculture markets. Its reportable segments are Infrastructure and Agriculture. The company generates maximum revenue from the Infrastructure segment, which includes the manufacturing and distribution of products and solutions to serve the infrastructure markets of utility, solar, lighting and transportation, and telecommunications, along with coatings services to protect metal products. The Agriculture segment provides irrigation equipment components, including aftermarket parts and tubular products, and technology solutions for precision agriculture. Geographically, it derives key revenue from the United States, followed by Australia, Brazil, and other regions.
Understanding the Numbers: Valmont Industries's Finances
Market Capitalization Analysis: The company's market capitalization is below the industry average, suggesting that it is relatively smaller compared to peers. This could be due to various factors, including perceived growth potential or operational scale.
Revenue Growth: Valmont Industries displayed positive results in 3 months. As of 31 December, 2024, the company achieved a solid revenue growth rate of approximately 2.14%. This indicates a notable increase in the company's top-line earnings. When compared to others in the Industrials sector, the company faces challenges, achieving a growth rate lower than the average among peers.
Net Margin: Valmont Industries's net margin lags behind industry averages, suggesting challenges in maintaining strong profitability. With a net margin of 7.49%, the company may face hurdles in effective cost management.
Return on Equity (ROE): Valmont Industries's ROE falls below industry averages, indicating challenges in efficiently using equity capital. With an ROE of 5.04%, the company may face hurdles in generating optimal returns for shareholders.
Return on Assets (ROA): Valmont Industries's ROA is below industry averages, indicating potential challenges in efficiently utilizing assets. With an ROA of 2.27%, the company may face hurdles in achieving optimal financial returns.
Debt Management: Valmont Industries's debt-to-equity ratio is below industry norms, indicating a sound financial structure with a ratio of 0.56.
To track all earnings releases for Valmont Industries visit their earnings calendar on our site.
This article was generated by Benzinga's automated content engine and reviewed by an editor.
Edge Rankings
Price Trend
© 2025 Benzinga.com. Benzinga does not provide investment advice. All rights reserved.
Trade confidently with insights and alerts from analyst ratings, free reports and breaking news that affects the stocks you care about.

