


Brandywine Realty Tr BDN is gearing up to announce its quarterly earnings on Tuesday, 2025-04-22. Here's a quick overview of what investors should know before the release.
Analysts are estimating that Brandywine Realty Tr will report an earnings per share (EPS) of $0.16.
Anticipation surrounds Brandywine Realty Tr's announcement, with investors hoping to hear about both surpassing estimates and receiving positive guidance for the next quarter.
New investors should understand that while earnings performance is important, market reactions are often driven by guidance.
Past Earnings Performance
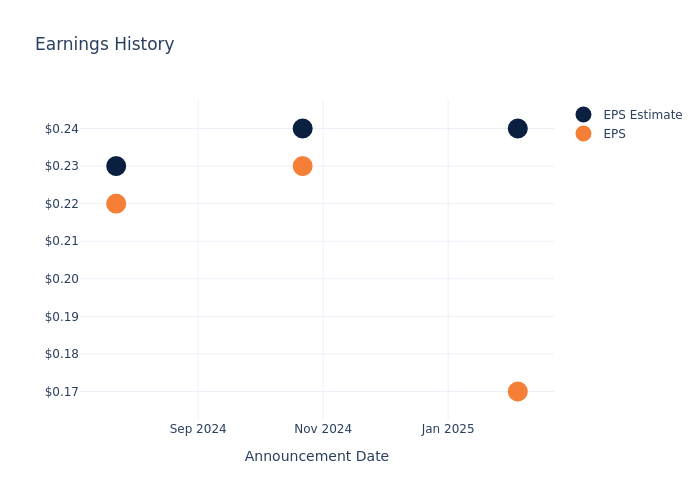
During the last quarter, the company reported an EPS missed by $0.07, leading to a 5.04% drop in the share price on the subsequent day.
Here's a look at Brandywine Realty Tr's past performance and the resulting price change:
| Quarter | Q4 2024 | Q3 2024 | Q2 2024 | Q1 2024 |
|---|---|---|---|---|
| EPS Estimate | 0.24 | 0.24 | 0.23 | 0.24 |
| EPS Actual | 0.17 | 0.23 | 0.22 | 0.24 |
| Price Change % | -5.0% | -14.000000000000002% | -4.0% | -1.0% |
Brandywine Realty Tr Share Price Analysis
Shares of Brandywine Realty Tr were trading at $3.78 as of April 18. Over the last 52-week period, shares are down 18.89%. Given that these returns are generally negative, long-term shareholders are likely unhappy going into this earnings release.
Analyst Views on Brandywine Realty Tr
For investors, staying informed about market sentiments and expectations in the industry is paramount. This analysis provides an exploration of the latest insights on Brandywine Realty Tr.
With 1 analyst ratings, Brandywine Realty Tr has a consensus rating of Neutral. The average one-year price target is $5.0, indicating a potential 32.28% upside.
Peer Ratings Comparison
In this comparison, we explore the analyst ratings and average 1-year price targets of Piedmont Office Realty, Peakstone Realty Tr and Net Lease Office, three prominent industry players, offering insights into their relative performance expectations and market positioning.
- Analysts currently favor an Buy trajectory for Piedmont Office Realty, with an average 1-year price target of $9.5, suggesting a potential 151.32% upside.
- Analysts currently favor an Neutral trajectory for Peakstone Realty Tr, with an average 1-year price target of $15.0, suggesting a potential 296.83% upside.
- Analysts currently favor an Buy trajectory for Net Lease Office, with an average 1-year price target of $46.0, suggesting a potential 1116.93% upside.
Overview of Peer Analysis
The peer analysis summary offers a detailed examination of key metrics for Piedmont Office Realty, Peakstone Realty Tr and Net Lease Office, providing valuable insights into their respective standings within the industry and their market positions and comparative performance.
| Company | Consensus | Revenue Growth | Gross Profit | Return on Equity |
|---|---|---|---|---|
| Brandywine Realty Tr | Neutral | -6.35% | $74.58M | -4.19% |
| Piedmont Office Realty | Buy | -1.44% | $84.63M | -1.86% |
| Peakstone Realty Tr | Neutral | -8.13% | $47.44M | 1.19% |
| Net Lease Office | Buy | -40.23% | $16.68M | -5.95% |
Key Takeaway:
Brandywine Realty Tr ranks at the bottom for Revenue Growth and Gross Profit among its peers. It is in the middle for Return on Equity.
Get to Know Brandywine Realty Tr Better
Brandywine Realty Trust engaged in the acquisition, development, redevelopment, ownership, management, and operation of a portfolio of office, life science/lab, residential, and mixed-use properties. The company owned and managed properties within five segments. The Philadelphia CBD segment includes properties located in the City of Philadelphia in Pennsylvania. The Pennsylvania Suburbs segment includes properties in Chester, Delaware and Montgomery counties in the Philadelphia suburbs. The Austin, Texas segment includes properties in the City of Austin, Texas. The Metropolitan Washington, D.C. segment includes properties in Northern Virginia, Washington, D.C. and Southern Maryland. The Other segment includes properties in Camden County, New Jersey and New Castle County, Delaware.
Understanding the Numbers: Brandywine Realty Tr's Finances
Market Capitalization Analysis: Falling below industry benchmarks, the company's market capitalization reflects a reduced size compared to peers. This positioning may be influenced by factors such as growth expectations or operational capacity.
Revenue Growth: Brandywine Realty Tr's revenue growth over a period of 3 months has faced challenges. As of 31 December, 2024, the company experienced a revenue decline of approximately -6.35%. This indicates a decrease in the company's top-line earnings. In comparison to its industry peers, the company trails behind with a growth rate lower than the average among peers in the Real Estate sector.
Net Margin: Brandywine Realty Tr's net margin falls below industry averages, indicating challenges in achieving strong profitability. With a net margin of -36.73%, the company may face hurdles in effective cost management.
Return on Equity (ROE): The company's ROE is below industry benchmarks, signaling potential difficulties in efficiently using equity capital. With an ROE of -4.19%, the company may need to address challenges in generating satisfactory returns for shareholders.
Return on Assets (ROA): Brandywine Realty Tr's ROA lags behind industry averages, suggesting challenges in maximizing returns from its assets. With an ROA of -1.26%, the company may face hurdles in achieving optimal financial performance.
Debt Management: Brandywine Realty Tr's debt-to-equity ratio stands notably higher than the industry average, reaching 2.15. This indicates a heavier reliance on borrowed funds, raising concerns about financial leverage.
To track all earnings releases for Brandywine Realty Tr visit their earnings calendar on our site.
This article was generated by Benzinga's automated content engine and reviewed by an editor.
Edge Rankings
Price Trend
© 2025 Benzinga.com. Benzinga does not provide investment advice. All rights reserved.
Trade confidently with insights and alerts from analyst ratings, free reports and breaking news that affects the stocks you care about.

