


Texas Instruments TXN is preparing to release its quarterly earnings on Wednesday, 2025-04-23. Here's a brief overview of what investors should keep in mind before the announcement.
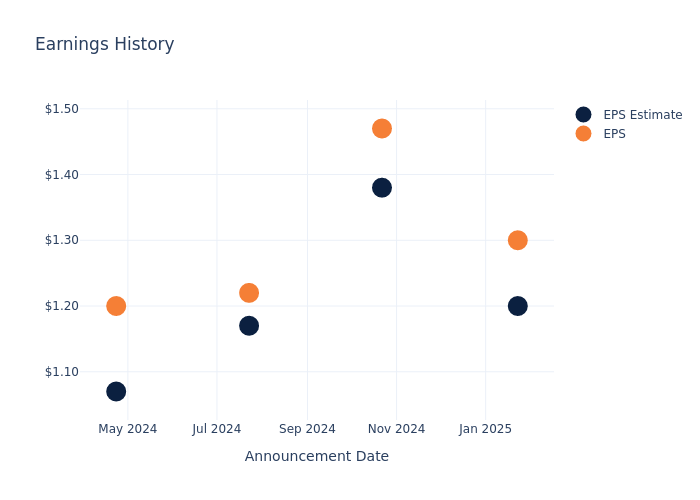
Analysts expect Texas Instruments to report an earnings per share (EPS) of $1.07.
Texas Instruments bulls will hope to hear the company announce they've not only beaten that estimate, but also to provide positive guidance, or forecasted growth, for the next quarter.
New investors should note that it is sometimes not an earnings beat or miss that most affects the price of a stock, but the guidance (or forecast).
Performance in Previous Earnings
Last quarter the company beat EPS by $0.10, which was followed by a 7.52% drop in the share price the next day.
Here's a look at Texas Instruments's past performance and the resulting price change:
| Quarter | Q4 2024 | Q3 2024 | Q2 2024 | Q1 2024 |
|---|---|---|---|---|
| EPS Estimate | 1.2 | 1.38 | 1.17 | 1.07 |
| EPS Actual | 1.3 | 1.47 | 1.22 | 1.20 |
| Price Change % | -8.0% | 4.0% | -0.0% | 6.0% |
Performance of Texas Instruments Shares
Shares of Texas Instruments were trading at $145.61 as of April 21. Over the last 52-week period, shares are down 15.56%. Given that these returns are generally negative, long-term shareholders are likely upset going into this earnings release.
Analyst Observations about Texas Instruments
For investors, grasping market sentiments and expectations in the industry is vital. This analysis explores the latest insights regarding Texas Instruments.
The consensus rating for Texas Instruments is Neutral, derived from 9 analyst ratings. An average one-year price target of $190.56 implies a potential 30.87% upside.
Comparing Ratings Among Industry Peers
In this comparison, we explore the analyst ratings and average 1-year price targets of Advanced Micro Devices and Qualcomm, three prominent industry players, offering insights into their relative performance expectations and market positioning.
- Analysts currently favor an Outperform trajectory for Advanced Micro Devices, with an average 1-year price target of $145.8, suggesting a potential 0.13% upside.
- Analysts currently favor an Buy trajectory for Qualcomm, with an average 1-year price target of $189.14, suggesting a potential 29.89% upside.
Peer Metrics Summary
The peer analysis summary presents essential metrics for Advanced Micro Devices and Qualcomm, unveiling their respective standings within the industry and providing valuable insights into their market positions and comparative performance.
| Company | Consensus | Revenue Growth | Gross Profit | Return on Equity |
|---|---|---|---|---|
| Texas Instruments | Neutral | -1.72% | $2.31B | 7.02% |
| Advanced Micro Devices | Outperform | 24.16% | $3.88B | 0.84% |
| Qualcomm | Buy | 17.45% | $6.51B | 11.97% |
Key Takeaway:
Texas Instruments ranks at the bottom for Revenue Growth among its peers. It is in the middle for Gross Profit. For Return on Equity, it is at the top among its peers.
Delving into Texas Instruments's Background
Dallas-based Texas Instruments generates over 95% of its revenue from semiconductors and the remainder from its well-known calculators. Texas Instruments is the world's largest maker of analog chips, which are used to process real-world signals such as sound and power. Texas Instruments also has a leading market share position in processors and microcontrollers used in a wide variety of electronics applications.
Texas Instruments's Financial Performance
Market Capitalization: Indicating a reduced size compared to industry averages, the company's market capitalization poses unique challenges.
Revenue Challenges: Texas Instruments's revenue growth over 3 months faced difficulties. As of 31 December, 2024, the company experienced a decline of approximately -1.72%. This indicates a decrease in top-line earnings. In comparison to its industry peers, the company trails behind with a growth rate lower than the average among peers in the Information Technology sector.
Net Margin: Texas Instruments's financial strength is reflected in its exceptional net margin, which exceeds industry averages. With a remarkable net margin of 29.92%, the company showcases strong profitability and effective cost management.
Return on Equity (ROE): Texas Instruments's ROE surpasses industry standards, highlighting the company's exceptional financial performance. With an impressive 7.02% ROE, the company effectively utilizes shareholder equity capital.
Return on Assets (ROA): Texas Instruments's ROA is below industry standards, pointing towards difficulties in efficiently utilizing assets. With an ROA of 3.39%, the company may encounter challenges in delivering satisfactory returns from its assets.
Debt Management: Texas Instruments's debt-to-equity ratio stands notably higher than the industry average, reaching 0.8. This indicates a heavier reliance on borrowed funds, raising concerns about financial leverage.
To track all earnings releases for Texas Instruments visit their earnings calendar on our site.
This article was generated by Benzinga's automated content engine and reviewed by an editor.
Edge Rankings
Price Trend
© 2025 Benzinga.com. Benzinga does not provide investment advice. All rights reserved.
Trade confidently with insights and alerts from analyst ratings, free reports and breaking news that affects the stocks you care about.

