


General Dynamics GD is preparing to release its quarterly earnings on Wednesday, 2025-04-23. Here's a brief overview of what investors should keep in mind before the announcement.
Analysts expect General Dynamics to report an earnings per share (EPS) of $3.42.
Anticipation surrounds General Dynamics's announcement, with investors hoping to hear about both surpassing estimates and receiving positive guidance for the next quarter.
New investors should understand that while earnings performance is important, market reactions are often driven by guidance.
Earnings History Snapshot
Last quarter the company beat EPS by $0.10, which was followed by a 2.18% increase in the share price the next day.
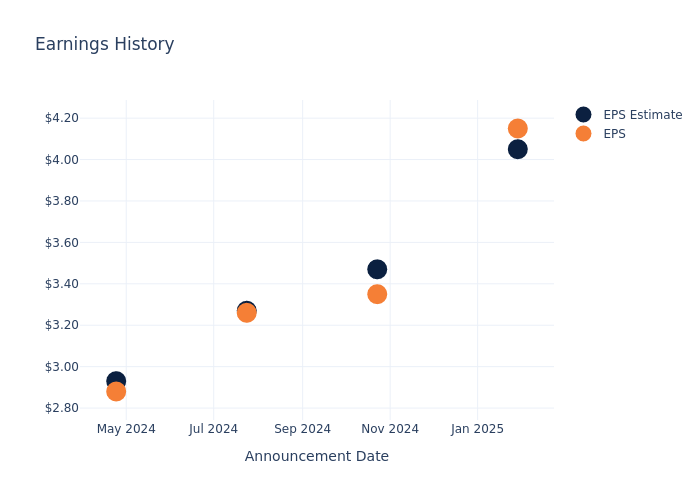
Here's a look at General Dynamics's past performance and the resulting price change:
| Quarter | Q4 2024 | Q3 2024 | Q2 2024 | Q1 2024 |
|---|---|---|---|---|
| EPS Estimate | 4.05 | 3.47 | 3.27 | 2.93 |
| EPS Actual | 4.15 | 3.35 | 3.26 | 2.88 |
| Price Change % | 2.0% | -1.0% | 2.0% | 1.0% |
Performance of General Dynamics Shares
Shares of General Dynamics were trading at $273.18 as of April 21. Over the last 52-week period, shares are down 2.71%. Given that these returns are generally negative, long-term shareholders are likely upset going into this earnings release.
Insights Shared by Analysts on General Dynamics
Understanding market sentiments and expectations within the industry is crucial for investors. This analysis delves into the latest insights on General Dynamics.
Analysts have given General Dynamics a total of 12 ratings, with the consensus rating being Neutral. The average one-year price target is $287.58, indicating a potential 5.27% upside.
Comparing Ratings Among Industry Peers
This comparison focuses on the analyst ratings and average 1-year price targets of Northrop Grumman, Howmet Aerospace and Axon Enterprise, three major players in the industry, shedding light on their relative performance expectations and market positioning.
- Analysts currently favor an Outperform trajectory for Northrop Grumman, with an average 1-year price target of $570.67, suggesting a potential 108.9% upside.
- Analysts currently favor an Buy trajectory for Howmet Aerospace, with an average 1-year price target of $136.11, suggesting a potential 50.18% downside.
- Analysts currently favor an Outperform trajectory for Axon Enterprise, with an average 1-year price target of $683.5, suggesting a potential 150.2% upside.
Key Findings: Peer Analysis Summary
Within the peer analysis summary, vital metrics for Northrop Grumman, Howmet Aerospace and Axon Enterprise are presented, shedding light on their respective standings within the industry and offering valuable insights into their market positions and comparative performance.
| Company | Consensus | Revenue Growth | Gross Profit | Return on Equity |
|---|---|---|---|---|
| General Dynamics | Neutral | 14.31% | $2.08B | 5.10% |
| Northrop Grumman | Outperform | 0.45% | $1.93B | 8.42% |
| Howmet Aerospace | Buy | 9.24% | $602M | 7.02% |
| Axon Enterprise | Outperform | 33.64% | $345.85M | 6.11% |
Key Takeaway:
General Dynamics ranks in the middle among peers for revenue growth, with one peer showing the highest growth. In terms of gross profit, General Dynamics is at the top compared to its peers. For return on equity, General Dynamics is at the bottom, with one peer having the highest return. The consensus rating for General Dynamics is neutral, while one peer has an outperform rating and another has a buy rating.
Discovering General Dynamics: A Closer Look
General Dynamics is a defense contractor and business jet manufacturer. The firm's segments include aerospace, marine, combat systems, and technology. General Dynamics' aerospace segment manufactures Gulfstream business jets and operates a global aircraft servicing operation. Combat systems produces land-based combat vehicles such as the M1 Abrams tank and Stryker armored personnel carrier, as well as munitions. The marine segment builds and services nuclear-powered submarines, destroyers, and other ships. The technologies segment contains two main units: an IT business that primarily serves the government market and a mission systems business that focuses on products that provide command, control, computing, intelligence, surveillance, and reconnaissance capabilities to the military.
General Dynamics's Financial Performance
Market Capitalization Analysis: With a profound presence, the company's market capitalization is above industry averages. This reflects substantial size and strong market recognition.
Revenue Growth: General Dynamics's remarkable performance in 3 months is evident. As of 31 December, 2024, the company achieved an impressive revenue growth rate of 14.31%. This signifies a substantial increase in the company's top-line earnings. In comparison to its industry peers, the company stands out with a growth rate higher than the average among peers in the Industrials sector.
Net Margin: General Dynamics's net margin surpasses industry standards, highlighting the company's exceptional financial performance. With an impressive 8.61% net margin, the company effectively manages costs and achieves strong profitability.
Return on Equity (ROE): General Dynamics's ROE excels beyond industry benchmarks, reaching 5.1%. This signifies robust financial management and efficient use of shareholder equity capital.
Return on Assets (ROA): General Dynamics's financial strength is reflected in its exceptional ROA, which exceeds industry averages. With a remarkable ROA of 2.03%, the company showcases efficient use of assets and strong financial health.
Debt Management: General Dynamics's debt-to-equity ratio is below the industry average at 0.48, reflecting a lower dependency on debt financing and a more conservative financial approach.
To track all earnings releases for General Dynamics visit their earnings calendar on our site.
This article was generated by Benzinga's automated content engine and reviewed by an editor.
Edge Rankings
Price Trend
© 2025 Benzinga.com. Benzinga does not provide investment advice. All rights reserved.
Trade confidently with insights and alerts from analyst ratings, free reports and breaking news that affects the stocks you care about.

