


Las Vegas Sands LVS is gearing up to announce its quarterly earnings on Wednesday, 2025-04-23. Here's a quick overview of what investors should know before the release.
Analysts are estimating that Las Vegas Sands will report an earnings per share (EPS) of $0.63.
The market awaits Las Vegas Sands's announcement, with hopes high for news of surpassing estimates and providing upbeat guidance for the next quarter.
It's important for new investors to understand that guidance can be a significant driver of stock prices.
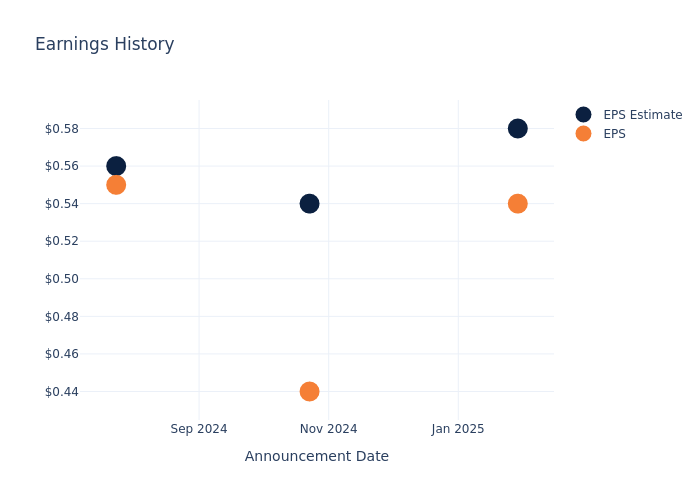
Historical Earnings Performance
The company's EPS missed by $0.04 in the last quarter, leading to a 11.08% increase in the share price on the following day.
Here's a look at Las Vegas Sands's past performance and the resulting price change:
| Quarter | Q4 2024 | Q3 2024 | Q2 2024 | Q1 2024 |
|---|---|---|---|---|
| EPS Estimate | 0.58 | 0.54 | 0.56 | 0.61 |
| EPS Actual | 0.54 | 0.44 | 0.55 | 0.75 |
| Price Change % | 11.0% | 3.0% | -2.0% | -9.0% |
Performance of Las Vegas Sands Shares
Shares of Las Vegas Sands were trading at $32.56 as of April 21. Over the last 52-week period, shares are down 26.77%. Given that these returns are generally negative, long-term shareholders are likely bearish going into this earnings release.
Analyst Opinions on Las Vegas Sands
For investors, grasping market sentiments and expectations in the industry is vital. This analysis explores the latest insights regarding Las Vegas Sands.
The consensus rating for Las Vegas Sands is Neutral, based on 5 analyst ratings. With an average one-year price target of $55.6, there's a potential 70.76% upside.
Comparing Ratings Among Industry Peers
The below comparison of the analyst ratings and average 1-year price targets of DraftKings, MGM Resorts International and Churchill Downs, three prominent players in the industry, gives insights for their relative performance expectations and market positioning.
- Analysts currently favor an Buy trajectory for DraftKings, with an average 1-year price target of $58.1, suggesting a potential 78.44% upside.
- Analysts currently favor an Outperform trajectory for MGM Resorts International, with an average 1-year price target of $47.5, suggesting a potential 45.88% upside.
- Analysts currently favor an Outperform trajectory for Churchill Downs, with an average 1-year price target of $146.88, suggesting a potential 351.11% upside.
Comprehensive Peer Analysis Summary
The peer analysis summary presents essential metrics for DraftKings, MGM Resorts International and Churchill Downs, unveiling their respective standings within the industry and providing valuable insights into their market positions and comparative performance.
| Company | Consensus | Revenue Growth | Gross Profit | Return on Equity |
|---|---|---|---|---|
| Las Vegas Sands | Neutral | -0.65% | $1.41B | 10.27% |
| DraftKings | Buy | 13.15% | $558.13M | -12.92% |
| MGM Resorts International | Outperform | -0.66% | $1.95B | 4.94% |
| Churchill Downs | Outperform | 11.23% | $179.70M | 6.58% |
Key Takeaway:
Las Vegas Sands ranks at the bottom for Revenue Growth among its peers. It is in the middle for Gross Profit. For Return on Equity, it is at the top.
Get to Know Las Vegas Sands Better
Las Vegas Sands is the world's largest operator of fully integrated resorts, featuring casino, hotel, entertainment, food and beverage, retail, and convention center operations. The company owns the Venetian Macao, Sands Macao, Londoner Macao, Four Seasons Hotel Macao, and Parisian Macao, as well as the Marina Bay Sands resort in Singapore. We expect Sands to open a fourth tower in Singapore in 2031. Its Venetian and Palazzo Las Vegas assets in the US were sold to Apollo and Vici in 2022. After the sale of its Vegas assets, the company generates all its EBITDA from Asia, with its casino operations generating the majority of sales.
Las Vegas Sands: Delving into Financials
Market Capitalization: Surpassing industry standards, the company's market capitalization asserts its dominance in terms of size, suggesting a robust market position.
Revenue Challenges: Las Vegas Sands's revenue growth over 3 months faced difficulties. As of 31 December, 2024, the company experienced a decline of approximately -0.65%. This indicates a decrease in top-line earnings. As compared to its peers, the revenue growth lags behind its industry peers. The company achieved a growth rate lower than the average among peers in Consumer Discretionary sector.
Net Margin: The company's net margin is a standout performer, exceeding industry averages. With an impressive net margin of 11.19%, the company showcases strong profitability and effective cost control.
Return on Equity (ROE): Las Vegas Sands's ROE stands out, surpassing industry averages. With an impressive ROE of 10.27%, the company demonstrates effective use of equity capital and strong financial performance.
Return on Assets (ROA): Las Vegas Sands's ROA surpasses industry standards, highlighting the company's exceptional financial performance. With an impressive 1.54% ROA, the company effectively utilizes its assets for optimal returns.
Debt Management: Las Vegas Sands's debt-to-equity ratio is below the industry average. With a ratio of 4.77, the company relies less on debt financing, maintaining a healthier balance between debt and equity, which can be viewed positively by investors.
To track all earnings releases for Las Vegas Sands visit their earnings calendar on our site.
This article was generated by Benzinga's automated content engine and reviewed by an editor.
Edge Rankings
Price Trend
© 2025 Benzinga.com. Benzinga does not provide investment advice. All rights reserved.
Trade confidently with insights and alerts from analyst ratings, free reports and breaking news that affects the stocks you care about.

