


Union Pacific UNP is preparing to release its quarterly earnings on Thursday, 2025-04-24. Here's a brief overview of what investors should keep in mind before the announcement.
Analysts expect Union Pacific to report an earnings per share (EPS) of $2.78.
The market awaits Union Pacific's announcement, with hopes high for news of surpassing estimates and providing upbeat guidance for the next quarter.
It's important for new investors to understand that guidance can be a significant driver of stock prices.
Overview of Past Earnings
During the last quarter, the company reported an EPS beat by $0.12, leading to a 0.29% increase in the share price on the subsequent day.
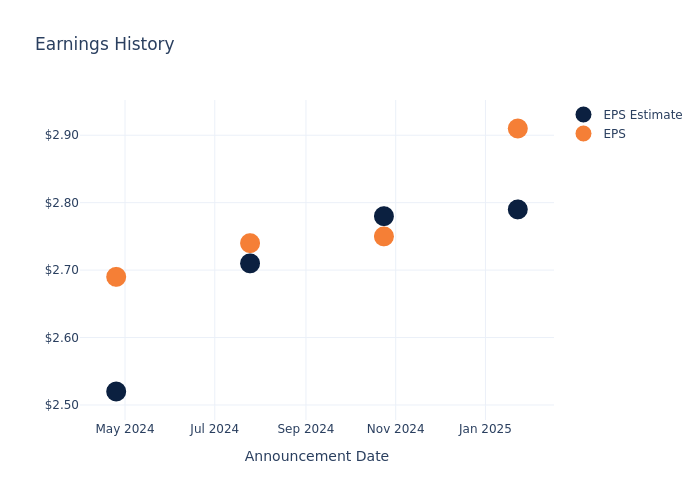
Here's a look at Union Pacific's past performance and the resulting price change:
| Quarter | Q4 2024 | Q3 2024 | Q2 2024 | Q1 2024 |
|---|---|---|---|---|
| EPS Estimate | 2.79 | 2.78 | 2.71 | 2.52 |
| EPS Actual | 2.91 | 2.75 | 2.74 | 2.69 |
| Price Change % | 0.0% | -0.0% | 2.0% | -0.0% |
Tracking Union Pacific's Stock Performance
Shares of Union Pacific were trading at $216.9 as of April 22. Over the last 52-week period, shares are down 8.21%. Given that these returns are generally negative, long-term shareholders are likely bearish going into this earnings release.
Analyst Insights on Union Pacific
Understanding market sentiments and expectations within the industry is crucial for investors. This analysis delves into the latest insights on Union Pacific.
The consensus rating for Union Pacific is Buy, based on 15 analyst ratings. With an average one-year price target of $255.53, there's a potential 17.81% upside.
Peer Ratings Overview
The analysis below examines the analyst ratings and average 1-year price targets of Uber Technologies, CSX and Norfolk Southern, three significant industry players, providing valuable insights into their relative performance expectations and market positioning.
- Analysts currently favor an Outperform trajectory for Uber Technologies, with an average 1-year price target of $87.39, suggesting a potential 59.71% downside.
- Analysts currently favor an Outperform trajectory for CSX, with an average 1-year price target of $34.57, suggesting a potential 84.06% downside.
- Analysts currently favor an Buy trajectory for Norfolk Southern, with an average 1-year price target of $272.86, suggesting a potential 25.8% upside.
Peer Metrics Summary
Within the peer analysis summary, vital metrics for Uber Technologies, CSX and Norfolk Southern are presented, shedding light on their respective standings within the industry and offering valuable insights into their market positions and comparative performance.
| Company | Consensus | Revenue Growth | Gross Profit | Return on Equity |
|---|---|---|---|---|
| Union Pacific | Buy | -0.62% | $2.81B | 10.53% |
| Uber Technologies | Outperform | 20.36% | $4.72B | 37.88% |
| CSX | Outperform | -7.01% | $1.04B | 5.24% |
| Norfolk Southern | Buy | -1.59% | $1.17B | 5.21% |
Key Takeaway:
Union Pacific ranks at the top for Gross Profit and Return on Equity among its peers. It is in the middle for Revenue Growth and at the bottom for Consensus rating.
Delving into Union Pacific's Background
Union Pacific Corp is the largest public railroad in North America. Operating on more than 30,000 miles of track in the western two thirds of the us, Union Pacific generated $24 billion of revenue in 2024 by hauling coal, industrial products, intermodal containers, agriculture goods, chemicals, fertilizers, and automotive goods. Union Pacific owns about one fourth of Mexican railroad Ferromex and historically derives roughly 10% of its revenue hauling freight to and from Mexico.
Unraveling the Financial Story of Union Pacific
Market Capitalization Analysis: The company's market capitalization is above the industry average, indicating that it is relatively larger in size compared to peers. This may suggest a higher level of investor confidence and market recognition.
Revenue Challenges: Union Pacific's revenue growth over 3 months faced difficulties. As of 31 December, 2024, the company experienced a decline of approximately -0.62%. This indicates a decrease in top-line earnings. As compared to its peers, the revenue growth lags behind its industry peers. The company achieved a growth rate lower than the average among peers in Industrials sector.
Net Margin: Union Pacific's financial strength is reflected in its exceptional net margin, which exceeds industry averages. With a remarkable net margin of 28.79%, the company showcases strong profitability and effective cost management.
Return on Equity (ROE): Union Pacific's financial strength is reflected in its exceptional ROE, which exceeds industry averages. With a remarkable ROE of 10.53%, the company showcases efficient use of equity capital and strong financial health.
Return on Assets (ROA): The company's ROA is a standout performer, exceeding industry averages. With an impressive ROA of 2.6%, the company showcases effective utilization of assets.
Debt Management: Union Pacific's debt-to-equity ratio is below the industry average. With a ratio of 1.92, the company relies less on debt financing, maintaining a healthier balance between debt and equity, which can be viewed positively by investors.
To track all earnings releases for Union Pacific visit their earnings calendar on our site.
This article was generated by Benzinga's automated content engine and reviewed by an editor.
Edge Rankings
Price Trend
© 2025 Benzinga.com. Benzinga does not provide investment advice. All rights reserved.
Trade confidently with insights and alerts from analyst ratings, free reports and breaking news that affects the stocks you care about.

