


NOV NOV is set to give its latest quarterly earnings report on Monday, 2025-04-28. Here's what investors need to know before the announcement.
Analysts estimate that NOV will report an earnings per share (EPS) of $0.26.
Anticipation surrounds NOV's announcement, with investors hoping to hear about both surpassing estimates and receiving positive guidance for the next quarter.
New investors should understand that while earnings performance is important, market reactions are often driven by guidance.
Overview of Past Earnings
The company's EPS beat by $0.05 in the last quarter, leading to a 12.69% increase in the share price on the following day.
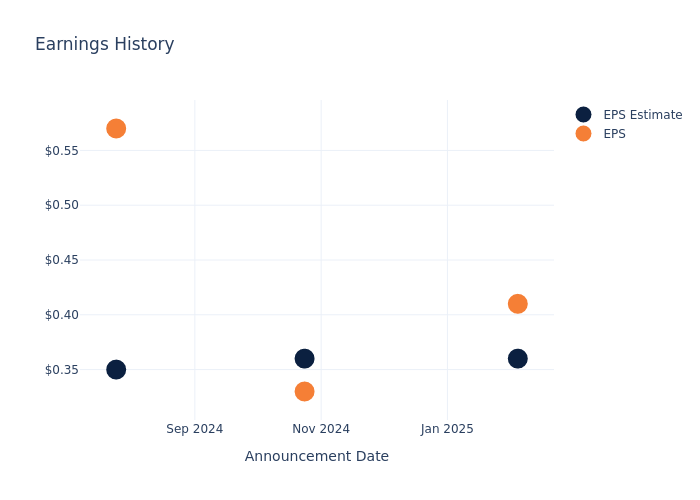
Here's a look at NOV's past performance and the resulting price change:
| Quarter | Q4 2024 | Q3 2024 | Q2 2024 | Q1 2024 |
|---|---|---|---|---|
| EPS Estimate | 0.36 | 0.36 | 0.35 | 0.27 |
| EPS Actual | 0.41 | 0.33 | 0.57 | 0.30 |
| Price Change % | 13.0% | 3.0% | 6.0% | -0.0% |
Stock Performance
Shares of NOV were trading at $12.34 as of April 24. Over the last 52-week period, shares are down 36.2%. Given that these returns are generally negative, long-term shareholders are likely bearish going into this earnings release.
Analyst Opinions on NOV
For investors, staying informed about market sentiments and expectations in the industry is paramount. This analysis provides an exploration of the latest insights on NOV.
A total of 8 analyst ratings have been received for NOV, with the consensus rating being Outperform. The average one-year price target stands at $18.62, suggesting a potential 50.89% upside.
Analyzing Analyst Ratings Among Peers
The following analysis focuses on the analyst ratings and average 1-year price targets of Archrock, Kodiak Gas Services and Weatherford International, three prominent industry players, providing insights into their relative performance expectations and market positioning.
- Analysts currently favor an Buy trajectory for Archrock, with an average 1-year price target of $33.0, suggesting a potential 167.42% upside.
- Analysts currently favor an Neutral trajectory for Kodiak Gas Services, with an average 1-year price target of $44.75, suggesting a potential 262.64% upside.
- Analysts currently favor an Outperform trajectory for Weatherford International, with an average 1-year price target of $84.67, suggesting a potential 586.14% upside.
Key Findings: Peer Analysis Summary
The peer analysis summary outlines pivotal metrics for Archrock, Kodiak Gas Services and Weatherford International, demonstrating their respective standings within the industry and offering valuable insights into their market positions and comparative performance.
| Company | Consensus | Revenue Growth | Gross Profit | Return on Equity |
|---|---|---|---|---|
| NOV | Outperform | -1.49% | $493M | 2.49% |
| Archrock | Buy | 25.74% | $151.17M | 4.52% |
| Kodiak Gas Services | Neutral | 36.97% | $120.86M | 1.46% |
| Weatherford International | Outperform | -12.15% | $374M | 5.76% |
Key Takeaway:
NOV ranks at the bottom for Revenue Growth among its peers, with a negative growth rate. It also has the lowest Gross Profit compared to its peers. However, NOV's Return on Equity is higher than two of its peers, positioning it in the middle for this metric.
Unveiling the Story Behind NOV
NOV (formerly National Oilwell Varco) is a leading supplier of oil and gas drilling rig equipment and products, such as downhole tools, drill pipe, and well casing. The company operates on a global scale, with international markets contributing nearly two thirds of its annual revenue.
Understanding the Numbers: NOV's Finances
Market Capitalization: Indicating a reduced size compared to industry averages, the company's market capitalization poses unique challenges.
Revenue Challenges: NOV's revenue growth over 3 months faced difficulties. As of 31 December, 2024, the company experienced a decline of approximately -1.49%. This indicates a decrease in top-line earnings. As compared to competitors, the company encountered difficulties, with a growth rate lower than the average among peers in the Energy sector.
Net Margin: NOV's financial strength is reflected in its exceptional net margin, which exceeds industry averages. With a remarkable net margin of 6.93%, the company showcases strong profitability and effective cost management.
Return on Equity (ROE): NOV's ROE falls below industry averages, indicating challenges in efficiently using equity capital. With an ROE of 2.49%, the company may face hurdles in generating optimal returns for shareholders.
Return on Assets (ROA): NOV's ROA excels beyond industry benchmarks, reaching 1.4%. This signifies efficient management of assets and strong financial health.
Debt Management: NOV's debt-to-equity ratio is below the industry average at 0.37, reflecting a lower dependency on debt financing and a more conservative financial approach.
To track all earnings releases for NOV visit their earnings calendar on our site.
This article was generated by Benzinga's automated content engine and reviewed by an editor.
Edge Rankings
Price Trend
© 2025 Benzinga.com. Benzinga does not provide investment advice. All rights reserved.
Trade confidently with insights and alerts from analyst ratings, free reports and breaking news that affects the stocks you care about.

