


Honeywell Intl HON is gearing up to announce its quarterly earnings on Tuesday, 2025-04-29. Here's a quick overview of what investors should know before the release.
Analysts are estimating that Honeywell Intl will report an earnings per share (EPS) of $2.21.
Anticipation surrounds Honeywell Intl's announcement, with investors hoping to hear about both surpassing estimates and receiving positive guidance for the next quarter.
New investors should understand that while earnings performance is important, market reactions are often driven by guidance.
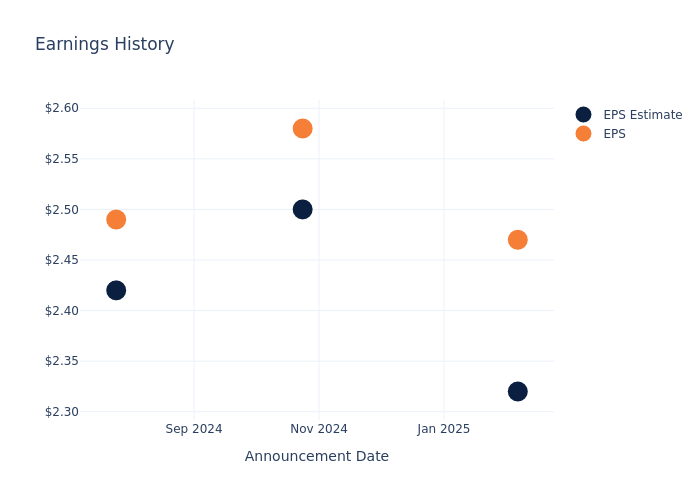
Earnings History Snapshot
During the last quarter, the company reported an EPS beat by $0.15, leading to a 2.05% drop in the share price on the subsequent day.
Here's a look at Honeywell Intl's past performance and the resulting price change:
| Quarter | Q4 2024 | Q3 2024 | Q2 2024 | Q1 2024 |
|---|---|---|---|---|
| EPS Estimate | 2.32 | 2.50 | 2.42 | 2.17 |
| EPS Actual | 2.47 | 2.58 | 2.49 | 2.25 |
| Price Change % | -2.0% | -1.0% | 0.0% | 0.0% |
Tracking Honeywell Intl's Stock Performance
Shares of Honeywell Intl were trading at $199.16 as of April 25. Over the last 52-week period, shares are up 4.55%. Given that these returns are generally positive, long-term shareholders should be satisfied going into this earnings release.
Analysts' Take on Honeywell Intl
Understanding market sentiments and expectations within the industry is crucial for investors. This analysis delves into the latest insights on Honeywell Intl.
Honeywell Intl has received a total of 8 ratings from analysts, with the consensus rating as Neutral. With an average one-year price target of $229.75, the consensus suggests a potential 15.36% upside.
Peer Ratings Overview
The analysis below examines the analyst ratings and average 1-year price targets of and 3M, three significant industry players, providing valuable insights into their relative performance expectations and market positioning.
- Analysts currently favor an Outperform trajectory for 3M, with an average 1-year price target of $140.14, suggesting a potential 29.63% downside.
Peer Metrics Summary
In the peer analysis summary, key metrics for and 3M are highlighted, providing an understanding of their respective standings within the industry and offering insights into their market positions and comparative performance.
| Company | Consensus | Revenue Growth | Gross Profit | Return on Equity |
|---|---|---|---|---|
| Honeywell Intl | Neutral | 6.86% | $3.67B | 7.13% |
| 3M | Outperform | -1.03% | $2.48B | 26.87% |
Key Takeaway:
Honeywell Intl ranks higher than its peers in terms of Revenue Growth and Gross Profit, indicating stronger performance in these areas. However, it lags behind in terms of Return on Equity. Overall, Honeywell Intl is positioned towards the top compared to its peers based on the provided metrics.
Discovering Honeywell Intl: A Closer Look
Honeywell traces its roots to 1885 with Albert Butz's firm, Butz Thermo-Electric Regulator, which produced a predecessor to the modern thermostat. Other inventions by Honeywell include biodegradable detergent and autopilot. Today, Honeywell is a global multi-industry behemoth with one of the largest installed bases of equipment. It operates through four business segments: aerospace technologies (37% of 2023 company revenue), industrial automation (29%), energy and sustainability solutions (17%), and building automation (17%). Recently, Honeywell has made several portfolio changes to focus on fewer end markets and align with a set of secular growth trends. The firm is working diligently to expand its installed base, deriving around 30% of its revenue from recurring aftermarket services.
A Deep Dive into Honeywell Intl's Financials
Market Capitalization Analysis: With a profound presence, the company's market capitalization is above industry averages. This reflects substantial size and strong market recognition.
Revenue Growth: Honeywell Intl displayed positive results in 3 months. As of 31 December, 2024, the company achieved a solid revenue growth rate of approximately 6.86%. This indicates a notable increase in the company's top-line earnings. In comparison to its industry peers, the company stands out with a growth rate higher than the average among peers in the Industrials sector.
Net Margin: Honeywell Intl's financial strength is reflected in its exceptional net margin, which exceeds industry averages. With a remarkable net margin of 12.74%, the company showcases strong profitability and effective cost management.
Return on Equity (ROE): Honeywell Intl's ROE excels beyond industry benchmarks, reaching 7.13%. This signifies robust financial management and efficient use of shareholder equity capital.
Return on Assets (ROA): The company's ROA is a standout performer, exceeding industry averages. With an impressive ROA of 1.73%, the company showcases effective utilization of assets.
Debt Management: The company maintains a balanced debt approach with a debt-to-equity ratio below industry norms, standing at 1.73.
To track all earnings releases for Honeywell Intl visit their earnings calendar on our site.
This article was generated by Benzinga's automated content engine and reviewed by an editor.
Edge Rankings
Price Trend
© 2025 Benzinga.com. Benzinga does not provide investment advice. All rights reserved.
Trade confidently with insights and alerts from analyst ratings, free reports and breaking news that affects the stocks you care about.

