


Sysco SYY will release its quarterly earnings report on Tuesday, 2025-04-29. Here's a brief overview for investors ahead of the announcement.
Analysts anticipate Sysco to report an earnings per share (EPS) of $1.04.
Investors in Sysco are eagerly awaiting the company's announcement, hoping for news of surpassing estimates and positive guidance for the next quarter.
It's worth noting for new investors that stock prices can be heavily influenced by future projections rather than just past performance.
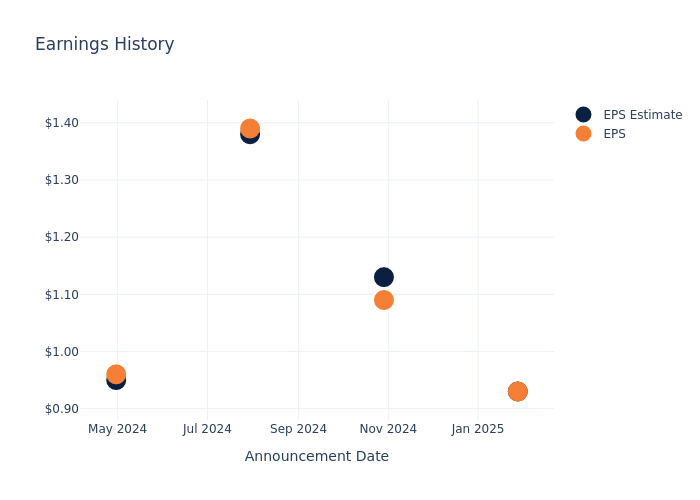
Earnings History Snapshot
In the previous earnings release, the company missed EPS by $0.00, leading to a 0.5% drop in the share price the following trading session.
Here's a look at Sysco's past performance and the resulting price change:
| Quarter | Q2 2025 | Q1 2025 | Q4 2024 | Q3 2024 |
|---|---|---|---|---|
| EPS Estimate | 0.93 | 1.13 | 1.38 | 0.95 |
| EPS Actual | 0.93 | 1.09 | 1.39 | 0.96 |
| Price Change % | -0.0% | 0.0% | 0.0% | -2.0% |
Performance of Sysco Shares
Shares of Sysco were trading at $70.93 as of April 25. Over the last 52-week period, shares are down 4.73%. Given that these returns are generally negative, long-term shareholders are likely bearish going into this earnings release.
Analysts' Take on Sysco
Understanding market sentiments and expectations within the industry is crucial for investors. This analysis delves into the latest insights on Sysco.
The consensus rating for Sysco is Outperform, derived from 8 analyst ratings. An average one-year price target of $84.0 implies a potential 18.43% upside.
Peer Ratings Comparison
The following analysis focuses on the analyst ratings and average 1-year price targets of US Foods Hldg, Performance Food Gr and The Chefs' Warehouse, three prominent industry players, providing insights into their relative performance expectations and market positioning.
- Analysts currently favor an Buy trajectory for US Foods Hldg, with an average 1-year price target of $81.0, suggesting a potential 14.2% upside.
- Analysts currently favor an Outperform trajectory for Performance Food Gr, with an average 1-year price target of $95.67, suggesting a potential 34.88% upside.
- Analysts currently favor an Buy trajectory for The Chefs' Warehouse, with an average 1-year price target of $69.2, suggesting a potential 2.44% downside.
Snapshot: Peer Analysis
The peer analysis summary provides a snapshot of key metrics for US Foods Hldg, Performance Food Gr and The Chefs' Warehouse, illuminating their respective standings within the industry. These metrics offer valuable insights into their market positions and comparative performance.
| Company | Consensus | Revenue Growth | Gross Profit | Return on Equity |
|---|---|---|---|---|
| Sysco | Outperform | 4.47% | $3.65B | 19.24% |
| US Foods Hldg | Buy | 6.21% | $1.67B | 1.45% |
| Performance Food Gr | Outperform | 9.39% | $1.83B | 1.00% |
| The Chefs' Warehouse | Buy | 8.74% | $250.96M | 4.70% |
Key Takeaway:
Sysco ranks at the top for Gross Profit and Return on Equity among its peers. It is in the middle for Revenue Growth.
Get to Know Sysco Better
Sysco is the largest US foodservice distributor with 17% share of the highly fragmented $370 billion domestic market. It distributes roughly 500,000 food and nonfood products to restaurants (62% of fiscal 2024 revenue), education and government buildings (7%), travel and leisure (6%), healthcare facilities (7%), and other locations (18%) where individuals consume away-from-home meals. In fiscal 2024, 70% of the firm's revenue was derived from its US foodservice operations, while its international (18%), quick-service logistics (10%), and other (2%) segments contributed the rest.
Sysco: A Financial Overview
Market Capitalization Analysis: Above industry benchmarks, the company's market capitalization emphasizes a noteworthy size, indicative of a strong market presence.
Revenue Growth: Over the 3 months period, Sysco showcased positive performance, achieving a revenue growth rate of 4.47% as of 31 December, 2024. This reflects a substantial increase in the company's top-line earnings. When compared to others in the Consumer Staples sector, the company faces challenges, achieving a growth rate lower than the average among peers.
Net Margin: Sysco's net margin excels beyond industry benchmarks, reaching 2.01%. This signifies efficient cost management and strong financial health.
Return on Equity (ROE): Sysco's financial strength is reflected in its exceptional ROE, which exceeds industry averages. With a remarkable ROE of 19.24%, the company showcases efficient use of equity capital and strong financial health.
Return on Assets (ROA): Sysco's ROA stands out, surpassing industry averages. With an impressive ROA of 1.59%, the company demonstrates effective utilization of assets and strong financial performance.
Debt Management: Sysco's debt-to-equity ratio is notably higher than the industry average. With a ratio of 6.8, the company relies more heavily on borrowed funds, indicating a higher level of financial risk.
To track all earnings releases for Sysco visit their earnings calendar on our site.
This article was generated by Benzinga's automated content engine and reviewed by an editor.
Edge Rankings
Price Trend
© 2025 Benzinga.com. Benzinga does not provide investment advice. All rights reserved.
Trade confidently with insights and alerts from analyst ratings, free reports and breaking news that affects the stocks you care about.

