


CoStar Gr CSGP is preparing to release its quarterly earnings on Tuesday, 2025-04-29. Here's a brief overview of what investors should keep in mind before the announcement.
Analysts expect CoStar Gr to report an earnings per share (EPS) of $0.10.
The announcement from CoStar Gr is eagerly anticipated, with investors seeking news of surpassing estimates and favorable guidance for the next quarter.
It's worth noting for new investors that guidance can be a key determinant of stock price movements.
Past Earnings Performance
Last quarter the company missed EPS by $0.08, which was followed by a 4.97% increase in the share price the next day.
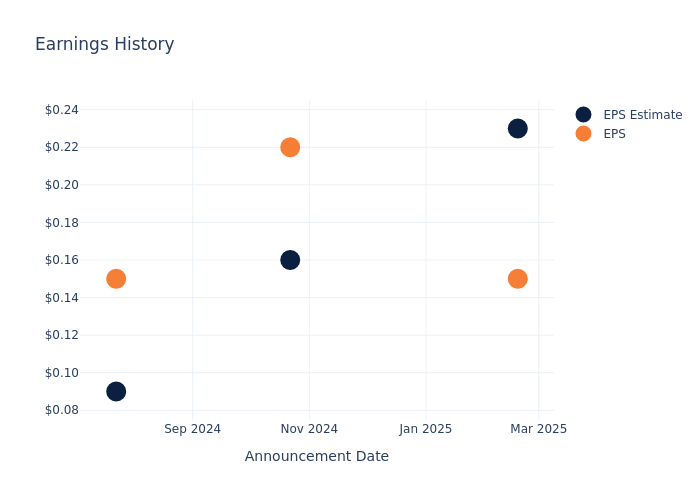
Here's a look at CoStar Gr's past performance and the resulting price change:
| Quarter | Q4 2024 | Q3 2024 | Q2 2024 | Q1 2024 |
|---|---|---|---|---|
| EPS Estimate | 0.23 | 0.16 | 0.09 | 0.07 |
| EPS Actual | 0.15 | 0.22 | 0.15 | 0.10 |
| Price Change % | 5.0% | -5.0% | 2.0% | 9.0% |
Stock Performance
Shares of CoStar Gr were trading at $82.82 as of April 25. Over the last 52-week period, shares are down 10.86%. Given that these returns are generally negative, long-term shareholders are likely bearish going into this earnings release.
Analyst Insights on CoStar Gr
For investors, staying informed about market sentiments and expectations in the industry is paramount. This analysis provides an exploration of the latest insights on CoStar Gr.
The consensus rating for CoStar Gr is Outperform, based on 14 analyst ratings. With an average one-year price target of $86.79, there's a potential 4.79% upside.
Peer Ratings Comparison
In this comparison, we explore the analyst ratings and average 1-year price targets of CBRE Group, Zillow Gr and Compass, three prominent industry players, offering insights into their relative performance expectations and market positioning.
- Analysts currently favor an Neutral trajectory for CBRE Group, with an average 1-year price target of $145.0, suggesting a potential 75.08% upside.
- Analysts currently favor an Buy trajectory for Zillow Gr, with an average 1-year price target of $85.88, suggesting a potential 3.69% upside.
- Analysts currently favor an Buy trajectory for Compass, with an average 1-year price target of $10.54, suggesting a potential 87.27% downside.
Peers Comparative Analysis Summary
In the peer analysis summary, key metrics for CBRE Group, Zillow Gr and Compass are highlighted, providing an understanding of their respective standings within the industry and offering insights into their market positions and comparative performance.
| Company | Consensus | Revenue Growth | Gross Profit | Return on Equity |
|---|---|---|---|---|
| CoStar Group | Outperform | 10.83% | $568.50M | 0.80% |
| CBRE Group | Neutral | -14.36% | $2.11B | 1.95% |
| Zillow Gr | Buy | 16.88% | $420M | -1.09% |
| Compass | Buy | 25.90% | $241.10M | -9.67% |
Key Takeaway:
CoStar Group is positioned at the top for Revenue Growth among its peers. It ranks at the bottom for Gross Profit and Return on Equity.
All You Need to Know About CoStar Gr
CoStar Group is a leading provider of commercial real estate data and marketplace listing platforms. Its data offering contains in-depth analytical information on over 5 million commercial real estate properties related to various subsectors including office, retail, hotels, multifamily, healthcare, industrial, self-storage, and data centers. It operates many flagship brands such as CoStar Suite, LoopNet, Apartments.com, BizBuySell, and Lands of America, with more than 80% of its revenue classified as subscription-based. The company recently expanded its presence in Canada, the United Kingdom, Spain, and France.
CoStar Gr's Financial Performance
Market Capitalization Analysis: The company's market capitalization surpasses industry averages, showcasing a dominant size relative to peers and suggesting a strong market position.
Revenue Growth: CoStar Gr's revenue growth over a period of 3 months has been noteworthy. As of 31 December, 2024, the company achieved a revenue growth rate of approximately 10.83%. This indicates a substantial increase in the company's top-line earnings. When compared to others in the Real Estate sector, the company faces challenges, achieving a growth rate lower than the average among peers.
Net Margin: CoStar Gr's net margin excels beyond industry benchmarks, reaching 8.43%. This signifies efficient cost management and strong financial health.
Return on Equity (ROE): CoStar Gr's ROE stands out, surpassing industry averages. With an impressive ROE of 0.8%, the company demonstrates effective use of equity capital and strong financial performance.
Return on Assets (ROA): CoStar Gr's ROA stands out, surpassing industry averages. With an impressive ROA of 0.65%, the company demonstrates effective utilization of assets and strong financial performance.
Debt Management: With a below-average debt-to-equity ratio of 0.15, CoStar Gr adopts a prudent financial strategy, indicating a balanced approach to debt management.
To track all earnings releases for CoStar Gr visit their earnings calendar on our site.
This article was generated by Benzinga's automated content engine and reviewed by an editor.
Edge Rankings
Price Trend
© 2025 Benzinga.com. Benzinga does not provide investment advice. All rights reserved.
Trade confidently with insights and alerts from analyst ratings, free reports and breaking news that affects the stocks you care about.

