In today's rapidly evolving and fiercely competitive business landscape, it is crucial for investors and industry analysts to conduct comprehensive company evaluations. In this article, we will undertake an in-depth industry comparison, assessing IBM IBM alongside its primary competitors in the IT Services industry. By meticulously examining crucial financial indicators, market positioning, and growth potential, we aim to provide valuable insights to investors and shed light on company's performance within the industry.
IBM Background
IBM looks to be a part of every aspect of an enterprise's IT needs. The company primarily sells software, IT services, consulting, and hardware. IBM operates in 175 countries and employs approximately 350,000 people. The company has a robust roster of 80,000 business partners to service 5,200 clients—which includes 95% of all Fortune 500. While IBM is a B2B company, IBM's outward impact is substantial. For example, IBM manages 90% of all credit card transactions globally and is responsible for 50% of all wireless connections in the world.
| Company | P/E | P/B | P/S | ROE | EBITDA (in billions) | Gross Profit (in billions) | Revenue Growth |
|---|---|---|---|---|---|---|---|
| International Business Machines Corp | 23.37 | 7.72 | 2.84 | 14.42% | $5.32 | $10.27 | 17.83% |
| Accenture PLC | 34.47 | 8.74 | 3.68 | 7.54% | $2.97 | $5.45 | 3.03% |
| Infosys Ltd | 28.30 | 8.65 | 4.49 | 7.58% | $0.96 | $1.39 | 0.09% |
| Cognizant Technology Solutions Corp | 19.10 | 3.05 | 2.05 | 4.07% | $0.87 | $1.69 | 0.82% |
| Gartner Inc | 39.66 | 63.44 | 6.33 | 31.22% | $0.29 | $0.96 | 5.78% |
| Wipro Ltd | 22.22 | 3.55 | 2.82 | 3.87% | $38.12 | $65.97 | -0.11% |
| EPAM Systems Inc | 35.55 | 4.99 | 3.54 | 2.96% | $0.17 | $0.36 | -6.1% |
| Globant SA | 65.16 | 5.84 | 5.04 | 2.63% | $0.06 | $0.2 | 18.83% |
| Endava PLC | 45.86 | 5.66 | 4.34 | 2.11% | $0.02 | $0.05 | -3.95% |
| Perficient Inc | 24.93 | 4.90 | 2.83 | 4.62% | $0.04 | $0.07 | -1.92% |
| Formula Systems (1985) Ltd | 16.23 | 1.73 | 0.39 | 2.69% | $0.06 | $0.16 | 4.33% |
| The Hackett Group Inc | 18.63 | 7.91 | 2.27 | 12.25% | $0.01 | $0.03 | 5.31% |
| CI&T Inc | 19.45 | 2.18 | 1.39 | 2.56% | $0.09 | $0.17 | -5.35% |
| Information Services Group Inc | 17.70 | 2.21 | 0.80 | 3.06% | $0.01 | $0.03 | 4.27% |
| CSP Inc | 21.83 | 2.44 | 1.65 | 2.92% | $0.0 | $0.01 | -8.14% |
| Average | 29.22 | 8.95 | 2.97 | 6.43% | $3.12 | $5.47 | 1.21% |
When closely examining IBM, the following trends emerge:
-
At 23.37, the stock's Price to Earnings ratio is 0.8x less than the industry average, suggesting favorable growth potential.
-
Considering a Price to Book ratio of 7.72, which is well below the industry average by 0.86x, the stock may be undervalued based on its book value compared to its peers.
-
The Price to Sales ratio is 2.84, which is 0.96x the industry average. This suggests a possible undervaluation based on sales performance.
-
The Return on Equity (ROE) of 14.42% is 7.99% above the industry average, highlighting efficient use of equity to generate profits.
-
With higher Earnings Before Interest, Taxes, Depreciation, and Amortization (EBITDA) of $5.32 Billion, which is 1.71x above the industry average, the company demonstrates stronger profitability and robust cash flow generation.
-
The company has higher gross profit of $10.27 Billion, which indicates 1.88x above the industry average, indicating stronger profitability and higher earnings from its core operations.
-
The company's revenue growth of 17.83% exceeds the industry average of 1.21%, indicating strong sales performance and market outperformance.
Debt To Equity Ratio

The debt-to-equity (D/E) ratio is an important measure to assess the financial structure and risk profile of a company.
Considering the debt-to-equity ratio in industry comparisons allows for a concise evaluation of a company's financial health and risk profile, aiding in informed decision-making.
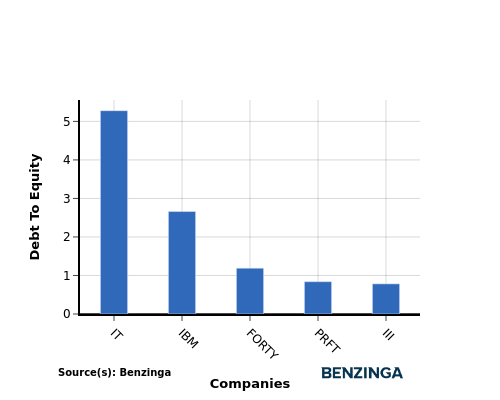
In light of the Debt-to-Equity ratio, a comparison between IBM and its top 4 peers reveals the following information:
-
In terms of the debt-to-equity ratio, IBM is positioned in the middle among its top 4 peers.
-
This suggests a relatively balanced financial structure, where the company maintains a moderate level of debt while also utilizing equity financing with a debt-to-equity ratio of 2.66.
Key Takeaways
IBM's low PE, PB, and PS ratios suggest that it is undervalued compared to its peers in the IT Services industry. Its high ROE, EBITDA, gross profit, and revenue growth indicate strong financial performance relative to its competitors.
This article was generated by Benzinga's automated content engine and reviewed by an editor.
Edge Rankings
Price Trend
© 2025 Benzinga.com. Benzinga does not provide investment advice. All rights reserved.
Trade confidently with insights and alerts from analyst ratings, free reports and breaking news that affects the stocks you care about.