In the dynamic and cutthroat world of business, conducting thorough company analysis is essential for investors and industry experts. In this article, we will undertake a comprehensive industry comparison, evaluating Visa V and its primary competitors in the Financial Services industry. By closely examining key financial metrics, market position, and growth prospects, our aim is to provide valuable insights for investors and shed light on company's performance within the industry.
Visa Background
Visa is the largest payment processor in the world. In fiscal 2022, it processed over $14 trillion in total volume. Visa operates in over 200 countries and processes transactions in over 160 currencies. Its systems are capable of processing over 65,000 transactions per second.
| Company | P/E | P/B | P/S | ROE | EBITDA (in billions) | Gross Profit (in billions) | Revenue Growth |
|---|---|---|---|---|---|---|---|
| Visa Inc | 31.25 | 13.83 | 16.84 | 12.46% | $6.48 | $6.97 | 8.8% |
| Mastercard Inc | 38.87 | 61.90 | 17.33 | 42.16% | $3.67 | $5.02 | 12.57% |
| Fiserv Inc | 29.76 | 2.92 | 4.78 | 2.93% | $2.16 | $3.08 | 6.18% |
| PayPal Holdings Inc | 16.54 | 3.18 | 2.36 | 6.87% | $2.14 | $3.67 | 8.71% |
| Block Inc | 3675 | 2.42 | 2.06 | 0.98% | $0.15 | $2.03 | 24.13% |
| Fidelity National Information Services Inc | 83.20 | 2.14 | 4.26 | 1.3% | $0.66 | $0.97 | -0.59% |
| Global Payments Inc | 32.67 | 1.37 | 3.34 | 1.59% | $0.99 | $1.51 | 8.03% |
| Corpay Inc | 22.45 | 6.49 | 5.87 | 8.07% | $0.51 | $0.74 | 6.08% |
| Jack Henry & Associates Inc | 32.30 | 6.97 | 5.58 | 5.43% | $0.17 | $0.22 | 7.99% |
| WEX Inc | 37.81 | 5.34 | 3.96 | 4.83% | $0.27 | $0.41 | 7.21% |
| StoneCo Ltd | 25.55 | 1.76 | 2.32 | 2.94% | $0.9 | $2.18 | 25.35% |
| Euronet Worldwide Inc | 18.50 | 3.73 | 1.42 | 5.79% | $0.15 | $0.36 | 10.63% |
| DLocal Ltd | 31.45 | 9.78 | 7.18 | 6.44% | $-0.02 | $0.07 | 58.75% |
| The Western Union Co | 7.64 | 9.12 | 1.10 | 23.25% | $0.22 | $0.4 | -3.63% |
| PagSeguro Digital Ltd | 12.28 | 1.56 | 2.25 | 3.74% | $1.79 | $0.2 | 7.56% |
| Shift4 Payments Inc | 43.30 | 5.91 | 1.47 | 2.6% | $0.09 | $0.2 | 31.19% |
| Evertec Inc | 31.06 | 4.07 | 3.56 | 2.04% | $0.06 | $0.1 | 20.29% |
| Paymentus Holdings Inc | 106.89 | 5.55 | 3.92 | 2.22% | $0.02 | $0.05 | 24.68% |
| Payoneer Global Inc | 20.02 | 2.67 | 2.27 | 4.15% | $0.03 | $0.19 | 22.21% |
| Average | 236.96 | 7.6 | 4.17 | 7.07% | $0.78 | $1.19 | 15.41% |
By conducting a comprehensive analysis of Visa, the following trends become evident:
-
The stock's Price to Earnings ratio of 31.25 is lower than the industry average by 0.13x, suggesting potential value in the eyes of market participants.
-
It could be trading at a premium in relation to its book value, as indicated by its Price to Book ratio of 13.83 which exceeds the industry average by 1.82x.
-
The Price to Sales ratio of 16.84, which is 4.04x the industry average, suggests the stock could potentially be overvalued in relation to its sales performance compared to its peers.
-
With a Return on Equity (ROE) of 12.46% that is 5.39% above the industry average, it appears that the company exhibits efficient use of equity to generate profits.
-
Compared to its industry, the company has higher Earnings Before Interest, Taxes, Depreciation, and Amortization (EBITDA) of $6.48 Billion, which is 8.31x above the industry average, indicating stronger profitability and robust cash flow generation.
-
The company has higher gross profit of $6.97 Billion, which indicates 5.86x above the industry average, indicating stronger profitability and higher earnings from its core operations.
-
The company's revenue growth of 8.8% is significantly below the industry average of 15.41%. This suggests a potential struggle in generating increased sales volume.
Debt To Equity Ratio

The debt-to-equity (D/E) ratio indicates the proportion of debt and equity used by a company to finance its assets and operations.
Considering the debt-to-equity ratio in industry comparisons allows for a concise evaluation of a company's financial health and risk profile, aiding in informed decision-making.
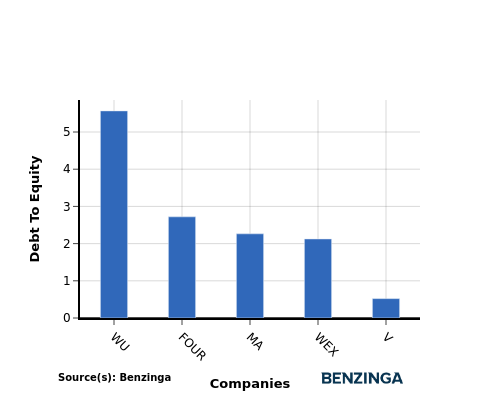
When examining Visa in comparison to its top 4 peers with respect to the Debt-to-Equity ratio, the following information becomes apparent:
-
Visa is in a relatively stronger financial position compared to its top 4 peers, as evidenced by its lower debt-to-equity ratio of 0.52.
-
This implies that the company relies less on debt financing and has a more favorable balance between debt and equity.
Key Takeaways
For Visa, the PE ratio is low compared to peers, indicating potential undervaluation. The high PB and PS ratios suggest strong market sentiment and premium valuation. In terms of ROE, EBITDA, and gross profit, Visa demonstrates high profitability and operational efficiency. However, the low revenue growth rate may raise concerns about future performance relative to industry peers in the Financial Services sector.
This article was generated by Benzinga's automated content engine and reviewed by an editor.
Edge Rankings
Price Trend
© 2025 Benzinga.com. Benzinga does not provide investment advice. All rights reserved.
Trade confidently with insights and alerts from analyst ratings, free reports and breaking news that affects the stocks you care about.