In today's rapidly changing and highly competitive business world, it is vital for investors and industry enthusiasts to carefully assess companies. In this article, we will perform a comprehensive industry comparison, evaluating Netflix NFLX against its key competitors in the Entertainment industry. By analyzing important financial metrics, market position, and growth prospects, we aim to provide valuable insights for investors and shed light on company's performance within the industry.
Netflix Background
Netflix's relatively simple business model involves only one business, its streaming service. It has the biggest television entertainment subscriber base in both the United States and the collective international market, with more than 280 million subscribers globally. Netflix has exposure to nearly the entire global population outside of China. The firm has traditionally avoided live programming or sports content, instead focusing on on-demand access to episodic television, movies, and documentaries. The firm recently began introducing ad-supported subscription plans, giving the firm exposure to the advertising market in addition to the subscription fees that have historically accounted for nearly all its revenue.
| Company | P/E | P/B | P/S | ROE | EBITDA (in billions) | Gross Profit (in billions) | Revenue Growth |
|---|---|---|---|---|---|---|---|
| Netflix Inc | 49.46 | 16.46 | 10.26 | 10.54% | $6.69 | $4.7 | 15.02% |
| Live Nation Entertainment Inc | 146.42 | 104.35 | 1.29 | 324.7% | $0.81 | $1.87 | -6.17% |
| Tencent Music Entertainment Group | 20.94 | 2.13 | 4.51 | 2.54% | $2.17 | $2.99 | 6.79% |
| Warner Music Group Corp | 35.30 | 29.30 | 2.36 | 8.19% | $0.17 | $0.78 | 2.77% |
| Scienjoy Holding Corp | 5.71 | 0.22 | 0.18 | 0.06% | $0.01 | $0.06 | -12.93% |
| Average | 52.09 | 34.0 | 2.08 | 83.87% | $0.79 | $1.43 | -2.38% |
After thoroughly examining Netflix, the following trends can be inferred:
-
A Price to Earnings ratio of 49.46 significantly below the industry average by 0.95x suggests undervaluation. This can make the stock appealing for those seeking growth.
-
The current Price to Book ratio of 16.46, which is 0.48x the industry average, is substantially lower than the industry average, indicating potential undervaluation.
-
The Price to Sales ratio of 10.26, which is 4.93x the industry average, suggests the stock could potentially be overvalued in relation to its sales performance compared to its peers.
-
The company has a lower Return on Equity (ROE) of 10.54%, which is 73.33% below the industry average. This indicates potential inefficiency in utilizing equity to generate profits, which could be attributed to various factors.
-
The company has higher Earnings Before Interest, Taxes, Depreciation, and Amortization (EBITDA) of $6.69 Billion, which is 8.47x above the industry average, indicating stronger profitability and robust cash flow generation.
-
Compared to its industry, the company has higher gross profit of $4.7 Billion, which indicates 3.29x above the industry average, indicating stronger profitability and higher earnings from its core operations.
-
The company's revenue growth of 15.02% is notably higher compared to the industry average of -2.38%, showcasing exceptional sales performance and strong demand for its products or services.
Debt To Equity Ratio

The debt-to-equity (D/E) ratio is an important measure to assess the financial structure and risk profile of a company.
Considering the debt-to-equity ratio in industry comparisons allows for a concise evaluation of a company's financial health and risk profile, aiding in informed decision-making.
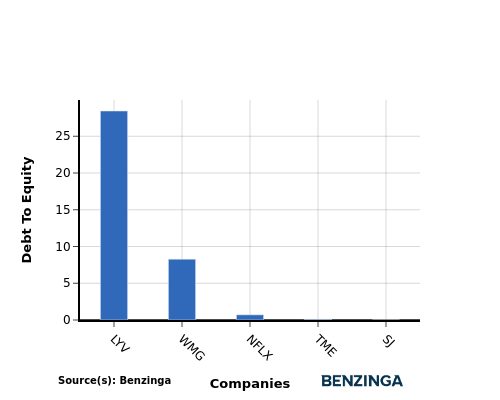
When comparing Netflix with its top 4 peers based on the Debt-to-Equity ratio, the following insights can be observed:
-
In the context of the debt-to-equity ratio, Netflix holds a middle position among its top 4 peers.
-
This indicates a moderate level of debt relative to its equity with a debt-to-equity ratio of 0.7, which implies a relatively balanced financial structure with a reasonable debt-equity mix.
Key Takeaways
For Netflix, the PE ratio is low compared to peers, indicating potential undervaluation. The PB ratio is also low, suggesting a possible bargain opportunity. However, the PS ratio is high, signaling overvaluation based on revenue. In terms of ROE, Netflix shows lower profitability compared to peers. EBITDA and gross profit margins are high, reflecting strong operational performance. Additionally, Netflix's revenue growth rate is high, outperforming industry peers.
This article was generated by Benzinga's automated content engine and reviewed by an editor.
Edge Rankings
Price Trend
© 2025 Benzinga.com. Benzinga does not provide investment advice. All rights reserved.
Trade confidently with insights and alerts from analyst ratings, free reports and breaking news that affects the stocks you care about.