


In today's rapidly changing and fiercely competitive business landscape, it is essential for investors and industry enthusiasts to thoroughly analyze companies. In this article, we will conduct a comprehensive industry comparison, evaluating NVIDIA NVDA against its key competitors in the Semiconductors & Semiconductor Equipment industry. By examining key financial metrics, market position, and growth prospects, we aim to provide valuable insights for investors and shed light on company's performance within the industry.
NVIDIA Background
Nvidia is a leading developer of graphics processing units. Traditionally, GPUs were used to enhance the experience on computing platforms, most notably in gaming applications on PCs. GPU use cases have since emerged as important semiconductors used in artificial intelligence. Nvidia not only offers AI GPUs, but also a software platform, Cuda, used for AI model development and training. Nvidia is also expanding its data center networking solutions, helping to tie GPUs together to handle complex workloads.
| Company | P/E | P/B | P/S | ROE | EBITDA (in billions) | Gross Profit (in billions) | Revenue Growth |
|---|---|---|---|---|---|---|---|
| NVIDIA Corp | 51.26 | 48.25 | 28.50 | 31.13% | $22.86 | $26.16 | 93.61% |
| Taiwan Semiconductor Manufacturing Co Ltd | 29.91 | 8.18 | 12.12 | 9.05% | $596.09 | $512.38 | 38.84% |
| Broadcom Inc | 174.32 | 15.57 | 20.83 | 6.49% | $7.29 | $9.0 | 51.2% |
| Qualcomm Inc | 18.12 | 6.91 | 4.66 | 11.46% | $3.21 | $5.78 | 18.69% |
| Advanced Micro Devices Inc | 107.56 | 3.03 | 6.83 | 1.36% | $1.55 | $3.42 | 17.57% |
| ARM Holdings PLC | 213.83 | 26.68 | 46.68 | 1.83% | $0.11 | $0.81 | 4.71% |
| Texas Instruments Inc | 34.62 | 9.71 | 10.58 | 7.05% | $2.09 | $2.47 | -3.47% |
| Micron Technology Inc | 26.45 | 2.20 | 3.56 | 4.07% | $4.3 | $3.35 | 84.28% |
| Analog Devices Inc | 62.56 | 2.89 | 10.86 | 1.36% | $1.12 | $1.42 | -10.06% |
| Monolithic Power Systems Inc | 19.68 | 10.95 | 15.94 | 6.35% | $0.17 | $0.34 | 30.59% |
| Microchip Technology Inc | 91.04 | 4.63 | 5.92 | 1.24% | $0.34 | $0.67 | -48.37% |
| ASE Technology Holding Co Ltd | 20.36 | 2.33 | 1.22 | 3.16% | $28.59 | $26.43 | 3.85% |
| ON Semiconductor Corp | 12.72 | 2.54 | 3.02 | 4.75% | $0.63 | $0.8 | -19.21% |
| STMicroelectronics NV | 13.54 | 1.15 | 1.59 | 1.95% | $0.74 | $1.23 | 2.15% |
| First Solar Inc | 14.50 | 2.37 | 4.70 | 4.22% | $0.45 | $0.45 | 10.81% |
| United Microelectronics Corp | 9.63 | 1.35 | 2.16 | 4.0% | $29.73 | $20.43 | 5.99% |
| Skyworks Solutions Inc | 20.21 | 1.65 | 2.62 | 0.95% | $0.18 | $0.43 | -15.9% |
| Lattice Semiconductor Corp | 52.25 | 10.45 | 13.12 | 1.03% | $0.03 | $0.09 | -33.87% |
| Qorvo Inc | 275.11 | 2.13 | 1.95 | 1.22% | $0.14 | $0.39 | -14.67% |
| Rambus Inc | 40.61 | 6.37 | 13.13 | 5.76% | $0.07 | $0.12 | 10.71% |
| Average | 65.11 | 6.37 | 9.55 | 4.07% | $35.62 | $31.05 | 7.04% |
By carefully studying NVIDIA, we can deduce the following trends:
-
At 51.26, the stock's Price to Earnings ratio is 0.79x less than the industry average, suggesting favorable growth potential.
-
With a Price to Book ratio of 48.25, which is 7.57x the industry average, NVIDIA might be considered overvalued in terms of its book value, as it is trading at a higher multiple compared to its industry peers.
-
With a relatively high Price to Sales ratio of 28.5, which is 2.98x the industry average, the stock might be considered overvalued based on sales performance.
-
The company has a higher Return on Equity (ROE) of 31.13%, which is 27.06% above the industry average. This suggests efficient use of equity to generate profits and demonstrates profitability and growth potential.
-
The Earnings Before Interest, Taxes, Depreciation, and Amortization (EBITDA) of $22.86 Billion is 0.64x below the industry average, suggesting potential lower profitability or financial challenges.
-
Compared to its industry, the company has lower gross profit of $26.16 Billion, which indicates 0.84x below the industry average, potentially indicating lower revenue after accounting for production costs.
-
The company's revenue growth of 93.61% is notably higher compared to the industry average of 7.04%, showcasing exceptional sales performance and strong demand for its products or services.
Debt To Equity Ratio
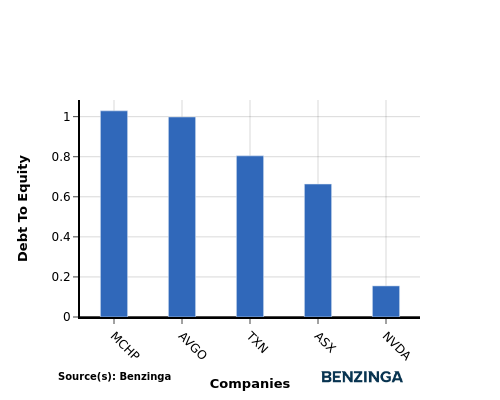
The debt-to-equity (D/E) ratio helps evaluate the capital structure and financial leverage of a company.
Considering the debt-to-equity ratio in industry comparisons allows for a concise evaluation of a company's financial health and risk profile, aiding in informed decision-making.
By evaluating NVIDIA against its top 4 peers in terms of the Debt-to-Equity ratio, the following observations arise:
-
When comparing the debt-to-equity ratio, NVIDIA is in a stronger financial position compared to its top 4 peers.
-
The company has a lower level of debt relative to its equity, indicating a more favorable balance between the two with a lower debt-to-equity ratio of 0.16.
Key Takeaways
The low P/E ratio suggests that NVIDIA may be undervalued compared to its peers in the Semiconductors & Semiconductor Equipment industry. However, the high P/B and P/S ratios indicate that the stock may be overvalued based on its book value and sales. On the other hand, the high ROE, low EBITDA, low gross profit, and high revenue growth highlight NVIDIA's strong profitability and growth potential relative to its industry competitors.
This article was generated by Benzinga's automated content engine and reviewed by an editor.
Edge Rankings
Price Trend
© 2025 Benzinga.com. Benzinga does not provide investment advice. All rights reserved.
Trade confidently with insights and alerts from analyst ratings, free reports and breaking news that affects the stocks you care about.

