
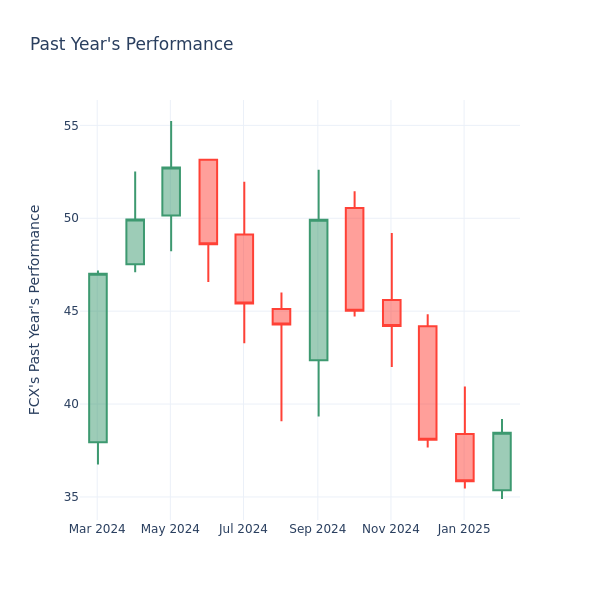
Looking into the current session, Freeport-McMoRan Inc. FCX shares are trading at $38.06, after a 1.04% drop. Over the past month, the stock fell by 2.26%, but over the past year, it actually went up by 3.39%. With questionable short-term performance like this, and great long-term performance, long-term shareholders might want to start looking into the company's price-to-earnings ratio.
Freeport-McMoRan P/E Compared to Competitors
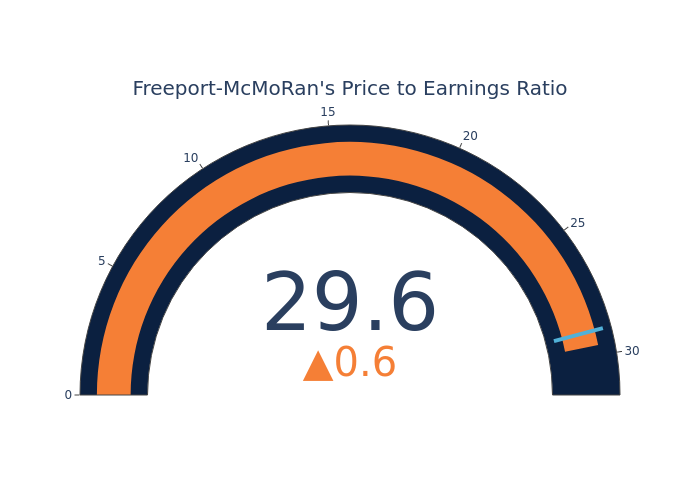
The P/E ratio is used by long-term shareholders to assess the company's market performance against aggregate market data, historical earnings, and the industry at large. A lower P/E could indicate that shareholders do not expect the stock to perform better in the future or it could mean that the company is undervalued.
Compared to the aggregate P/E ratio of 28.97 in the Metals & Mining industry, Freeport-McMoRan Inc. has a higher P/E ratio of 29.58. Shareholders might be inclined to think that Freeport-McMoRan Inc. might perform better than its industry group. It's also possible that the stock is overvalued.
In conclusion, the price-to-earnings ratio is a useful metric for analyzing a company's market performance, but it has its limitations. While a lower P/E can indicate that a company is undervalued, it can also suggest that shareholders do not expect future growth. Additionally, the P/E ratio should not be used in isolation, as other factors such as industry trends and business cycles can also impact a company's stock price. Therefore, investors should use the P/E ratio in conjunction with other financial metrics and qualitative analysis to make informed investment decisions.
Edge Rankings
Price Trend
© 2025 Benzinga.com. Benzinga does not provide investment advice. All rights reserved.
Trade confidently with insights and alerts from analyst ratings, free reports and breaking news that affects the stocks you care about.

