
Amidst today's fast-paced and highly competitive business environment, it is crucial for investors and industry enthusiasts to conduct comprehensive company evaluations. In this article, we will delve into an extensive industry comparison, evaluating Amazon.com AMZN in comparison to its major competitors within the Broadline Retail industry. By analyzing critical financial metrics, market position, and growth potential, our objective is to provide valuable insights for investors and offer a deeper understanding of company's performance in the industry.
Amazon.com Background
Amazon is the leading online retailer and marketplace for third party sellers. Retail related revenue represents approximately 75% of total, followed by Amazon Web Services' cloud computing, storage, database, and other offerings (15%), advertising services (5% to 10%), and other the remainder. International segments constitute 25% to 30% of Amazon's non-AWS sales, led by Germany, the United Kingdom, and Japan.
| Company | P/E | P/B | P/S | ROE | EBITDA (in billions) | Gross Profit (in billions) | Revenue Growth |
|---|---|---|---|---|---|---|---|
| Amazon.com Inc | 42.16 | 8.64 | 3.92 | 6.19% | $32.08 | $31.0 | 11.04% |
| Alibaba Group Holding Ltd | 23.05 | 2.02 | 2.09 | 4.64% | $54.02 | $92.47 | 5.21% |
| PDD Holdings Inc | 11.53 | 4.23 | 3.35 | 9.38% | $29.18 | $59.65 | 44.33% |
| MercadoLibre Inc | 72.44 | 25.87 | 5.66 | 10.37% | $0.72 | $2.44 | 35.27% |
| JD.com Inc | 13.65 | 1.95 | 0.43 | 5.22% | $15.92 | $45.04 | 5.12% |
| Coupang Inc | 41.77 | 10.20 | 1.48 | 1.74% | $0.28 | $2.27 | 27.2% |
| eBay Inc | 17.19 | 6.03 | 3.39 | 11.59% | $0.95 | $1.85 | 3.04% |
| Vipshop Holdings Ltd | 7.34 | 1.52 | 0.55 | 2.76% | $1.47 | $4.96 | -9.18% |
| Dillard's Inc | 12.63 | 3.97 | 1.18 | 6.37% | $0.21 | $0.63 | -3.53% |
| MINISO Group Holding Ltd | 23.53 | 5.56 | 3.84 | 6.68% | $0.88 | $2.03 | 19.29% |
| Ollie's Bargain Outlet Holdings Inc | 30.73 | 3.91 | 2.83 | 2.24% | $0.06 | $0.21 | 7.79% |
| Macy's Inc | 23.82 | 0.97 | 0.17 | 0.66% | $0.29 | $2.04 | -2.68% |
| Nordstrom Inc | 15.38 | 4.06 | 0.27 | 4.75% | $0.3 | $1.31 | 4.34% |
| Savers Value Village Inc | 24.11 | 4.10 | 1.22 | 5.09% | $0.07 | $0.22 | 0.53% |
| Kohl's Corp | 5.32 | 0.35 | 0.08 | 0.58% | $0.28 | $1.57 | -8.49% |
| Groupon Inc | 17.04 | 11.69 | 0.87 | 34.72% | $0.03 | $0.1 | -9.48% |
| Hour Loop Inc | 45.60 | 11.98 | 0.56 | 7.3% | $0.0 | $0.02 | 6.6% |
| Average | 24.07 | 6.15 | 1.75 | 7.13% | $6.54 | $13.55 | 7.83% |
Through a thorough examination of Amazon.com, we can discern the following trends:
-
The current Price to Earnings ratio of 42.16 is 1.75x higher than the industry average, indicating the stock is priced at a premium level according to the market sentiment.
-
The elevated Price to Book ratio of 8.64 relative to the industry average by 1.4x suggests company might be overvalued based on its book value.
-
The stock's relatively high Price to Sales ratio of 3.92, surpassing the industry average by 2.24x, may indicate an aspect of overvaluation in terms of sales performance.
-
The Return on Equity (ROE) of 6.19% is 0.94% below the industry average, suggesting potential inefficiency in utilizing equity to generate profits.
-
The company has higher Earnings Before Interest, Taxes, Depreciation, and Amortization (EBITDA) of $32.08 Billion, which is 4.91x above the industry average, indicating stronger profitability and robust cash flow generation.
-
The company has higher gross profit of $31.0 Billion, which indicates 2.29x above the industry average, indicating stronger profitability and higher earnings from its core operations.
-
The company's revenue growth of 11.04% exceeds the industry average of 7.83%, indicating strong sales performance and market outperformance.
Debt To Equity Ratio
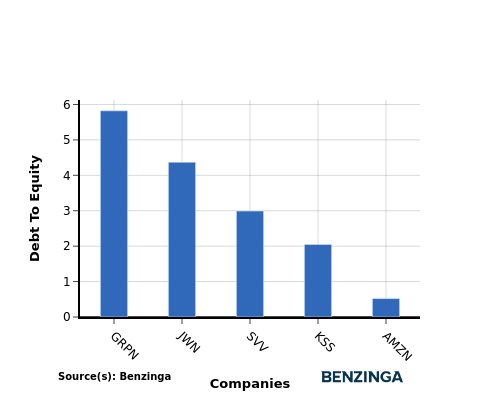
The debt-to-equity (D/E) ratio is an important measure to assess the financial structure and risk profile of a company.
Considering the debt-to-equity ratio in industry comparisons allows for a concise evaluation of a company's financial health and risk profile, aiding in informed decision-making.
When assessing Amazon.com against its top 4 peers using the Debt-to-Equity ratio, the following comparisons can be made:
-
Amazon.com exhibits a stronger financial position compared to its top 4 peers in the sector, as indicated by its lower debt-to-equity ratio of 0.52.
-
This suggests that the company has a more favorable balance between debt and equity, which can be seen as a positive aspect for investors.
Key Takeaways
For Amazon.com, the PE, PB, and PS ratios are all high compared to its peers in the Broadline Retail industry, indicating that the stock may be overvalued. The low ROE suggests that Amazon.com is not generating significant returns on shareholder equity. However, the high EBITDA, gross profit, and revenue growth show that the company is performing well in terms of operational efficiency and revenue generation within the industry sector.
This article was generated by Benzinga's automated content engine and reviewed by an editor.
Edge Rankings
Price Trend
© 2025 Benzinga.com. Benzinga does not provide investment advice. All rights reserved.
Trade confidently with insights and alerts from analyst ratings, free reports and breaking news that affects the stocks you care about.

