


In the ever-evolving and intensely competitive business landscape, conducting a thorough company analysis is of utmost importance for investors and industry followers. In this article, we will carry out an in-depth industry comparison, assessing Microsoft MSFT alongside its primary competitors in the Software industry. By meticulously examining key financial metrics, market positioning, and growth prospects, we aim to offer valuable insights to investors and shed light on company's performance within the industry.
Microsoft Background
Microsoft develops and licenses consumer and enterprise software. It is known for its Windows operating systems and Office productivity suite. The company is organized into three equally sized broad segments: productivity and business processes (legacy Microsoft Office, cloud-based Office 365, Exchange, SharePoint, Skype, LinkedIn, Dynamics), intelligence cloud (infrastructure- and platform-as-a-service offerings Azure, Windows Server OS, SQL Server), and more personal computing (Windows Client, Xbox, Bing search, display advertising, and Surface laptops, tablets, and desktops).
| Company | P/E | P/B | P/S | ROE | EBITDA (in billions) | Gross Profit (in billions) | Revenue Growth |
|---|---|---|---|---|---|---|---|
| Microsoft Corp | 32.21 | 9.82 | 11.41 | 8.17% | $36.79 | $47.83 | 12.27% |
| Oracle Corp | 42.17 | 35.09 | 8.93 | 25.66% | $5.75 | $9.97 | 8.64% |
| ServiceNow Inc | 137.71 | 20.24 | 17.87 | 4.06% | $0.62 | $2.33 | 21.34% |
| Palo Alto Networks Inc | 107.09 | 19.69 | 15.68 | 4.35% | $0.41 | $1.66 | 14.29% |
| CrowdStrike Holdings Inc | 773.65 | 31.78 | 26.38 | -0.57% | $0.05 | $0.76 | 28.52% |
| Fortinet Inc | 48.24 | 56.12 | 14.13 | 43.82% | $0.66 | $1.35 | 17.31% |
| Gen Digital Inc | 26.95 | 7.88 | 4.42 | 7.48% | $0.45 | $0.79 | 4.01% |
| Monday.Com Ltd | 493.61 | 14.81 | 16.51 | 2.3% | $-0.02 | $0.23 | 6.76% |
| Dolby Laboratories Inc | 30.22 | 3.14 | 6.03 | 2.72% | $0.11 | $0.32 | 13.13% |
| CommVault Systems Inc | 45.22 | 26.27 | 8.23 | 3.9% | $0.02 | $0.21 | 21.13% |
| QXO Inc | 21.44 | 1.10 | 19.53 | -0.21% | $-0.03 | $0.01 | -2.0% |
| Qualys Inc | 28.66 | 10.19 | 8.19 | 9.49% | $0.05 | $0.13 | 10.11% |
| SolarWinds Corp | 28.62 | 2.24 | 4.01 | 5.26% | $0.07 | $0.19 | 6.14% |
| Progress Software Corp | 36.06 | 5.49 | 3.27 | 0.27% | $0.05 | $0.18 | 21.47% |
| Teradata Corp | 20.67 | 17.06 | 1.35 | 19.38% | $0.06 | $0.24 | -10.5% |
| N-able Inc | 51.20 | 2.51 | 4.20 | 1.44% | $0.03 | $0.1 | 8.25% |
| Average | 126.1 | 16.91 | 10.58 | 8.62% | $0.55 | $1.23 | 11.24% |
Through a thorough examination of Microsoft, we can discern the following trends:
-
The stock's Price to Earnings ratio of 32.21 is lower than the industry average by 0.26x, suggesting potential value in the eyes of market participants.
-
Considering a Price to Book ratio of 9.82, which is well below the industry average by 0.58x, the stock may be undervalued based on its book value compared to its peers.
-
With a relatively high Price to Sales ratio of 11.41, which is 1.08x the industry average, the stock might be considered overvalued based on sales performance.
-
The Return on Equity (ROE) of 8.17% is 0.45% below the industry average, suggesting potential inefficiency in utilizing equity to generate profits.
-
Compared to its industry, the company has higher Earnings Before Interest, Taxes, Depreciation, and Amortization (EBITDA) of $36.79 Billion, which is 66.89x above the industry average, indicating stronger profitability and robust cash flow generation.
-
Compared to its industry, the company has higher gross profit of $47.83 Billion, which indicates 38.89x above the industry average, indicating stronger profitability and higher earnings from its core operations.
-
With a revenue growth of 12.27%, which surpasses the industry average of 11.24%, the company is demonstrating robust sales expansion and gaining market share.
Debt To Equity Ratio
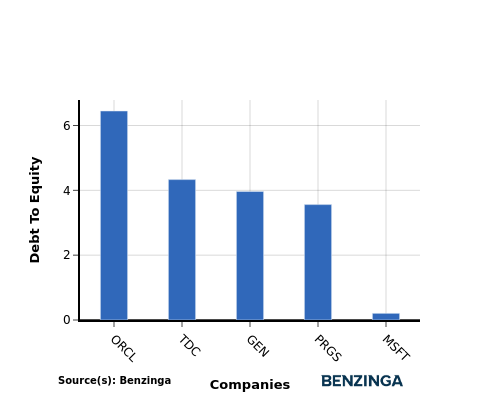
The debt-to-equity (D/E) ratio helps evaluate the capital structure and financial leverage of a company.
Considering the debt-to-equity ratio in industry comparisons allows for a concise evaluation of a company's financial health and risk profile, aiding in informed decision-making.
In terms of the Debt-to-Equity ratio, Microsoft can be assessed by comparing it to its top 4 peers, resulting in the following observations:
-
Microsoft has a stronger financial position compared to its top 4 peers, as evidenced by its lower debt-to-equity ratio of 0.21.
-
This suggests that the company has a more favorable balance between debt and equity, which can be perceived as a positive indicator by investors.
Key Takeaways
For Microsoft in the Software industry, the PE and PB ratios suggest that the stock is undervalued compared to its peers. However, the high PS ratio indicates that the market values its sales more highly. In terms of ROE, Microsoft's performance is weaker than its peers, while its high EBITDA and gross profit margins indicate strong operational efficiency. Additionally, the high revenue growth suggests potential for future expansion and market dominance.
This article was generated by Benzinga's automated content engine and reviewed by an editor.
Edge Rankings
Price Trend
© 2025 Benzinga.com. Benzinga does not provide investment advice. All rights reserved.
Trade confidently with insights and alerts from analyst ratings, free reports and breaking news that affects the stocks you care about.

