
In the dynamic and cutthroat world of business, conducting thorough company analysis is essential for investors and industry experts. In this article, we will undertake a comprehensive industry comparison, evaluating Tesla TSLA and its primary competitors in the Automobiles industry. By closely examining key financial metrics, market position, and growth prospects, our aim is to provide valuable insights for investors and shed light on company's performance within the industry.
Tesla Background
Tesla is a vertically integrated battery electric vehicle automaker and developer of autonomous driving software. The company has multiple vehicles in its fleet, which include luxury and midsize sedans, crossover SUVs, a light truck, and a semi truck. Tesla also plans to begin selling more affordable vehicles, a sports car, and offer a robotaxi service. Global deliveries in 2024 were a little below 1.8 million vehicles. The company sells batteries for stationary storage for residential and commercial properties including utilities and solar panels and solar roofs for energy generation. Tesla also owns a fast-charging network.
| Company | P/E | P/B | P/S | ROE | EBITDA (in billions) | Gross Profit (in billions) | Revenue Growth |
|---|---|---|---|---|---|---|---|
| Tesla Inc | 143.62 | 12.92 | 10.49 | 3.24% | $4.36 | $4.18 | 2.15% |
| Toyota Motor Corp | 7.07 | 0.98 | 0.77 | 6.24% | $3363.38 | $2378.91 | 2.91% |
| General Motors Co | 7.71 | 0.78 | 0.30 | -2.57% | $0.89 | $4.85 | 10.99% |
| Ford Motor Co | 6.54 | 0.84 | 0.21 | 4.09% | $4.06 | $4.01 | 4.89% |
| Li Auto Inc | 23.20 | 3.56 | 1.77 | 4.35% | $3.48 | $9.22 | 23.63% |
| Thor Industries Inc | 25.35 | 1.30 | 0.55 | -0.05% | $0.08 | $0.28 | -14.31% |
| Faraday Future Intelligent Electric Inc | 0 | 0.64 | 16.97 | -53.59% | $-0.06 | $-0.02 | -98.37% |
| Average | 11.65 | 1.35 | 3.43 | -6.92% | $561.97 | $399.54 | -11.71% |
After thoroughly examining Tesla, the following trends can be inferred:
-
The current Price to Earnings ratio of 143.62 is 12.33x higher than the industry average, indicating the stock is priced at a premium level according to the market sentiment.
-
The elevated Price to Book ratio of 12.92 relative to the industry average by 9.57x suggests company might be overvalued based on its book value.
-
The Price to Sales ratio of 10.49, which is 3.06x the industry average, suggests the stock could potentially be overvalued in relation to its sales performance compared to its peers.
-
The Return on Equity (ROE) of 3.24% is 10.16% above the industry average, highlighting efficient use of equity to generate profits.
-
The Earnings Before Interest, Taxes, Depreciation, and Amortization (EBITDA) of $4.36 Billion is 0.01x below the industry average, suggesting potential lower profitability or financial challenges.
-
The gross profit of $4.18 Billion is 0.01x below that of its industry, suggesting potential lower revenue after accounting for production costs.
-
The company's revenue growth of 2.15% is notably higher compared to the industry average of -11.71%, showcasing exceptional sales performance and strong demand for its products or services.
Debt To Equity Ratio
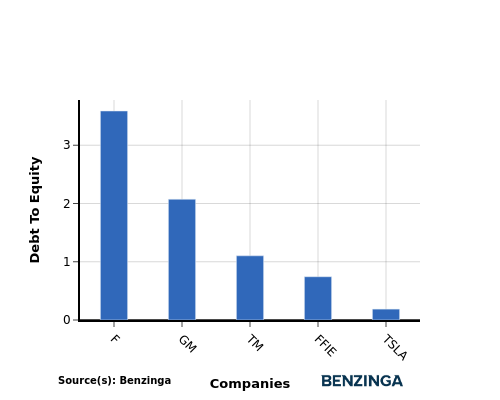
The debt-to-equity (D/E) ratio gauges the extent to which a company has financed its operations through debt relative to equity.
Considering the debt-to-equity ratio in industry comparisons allows for a concise evaluation of a company's financial health and risk profile, aiding in informed decision-making.
When comparing Tesla with its top 4 peers based on the Debt-to-Equity ratio, the following insights can be observed:
-
Among its top 4 peers, Tesla has a stronger financial position with a lower debt-to-equity ratio of 0.19.
-
This indicates that the company relies less on debt financing and maintains a more favorable balance between debt and equity, which can be viewed positively by investors.
Key Takeaways
In comparison to its peers in the Automobiles industry, Tesla's PE, PB, and PS ratios are all considered high, indicating that the stock may be overvalued relative to its earnings, book value, and sales. On the other hand, Tesla's high ROE and revenue growth suggest strong profitability and potential for future growth, despite its low EBITDA and gross profit margins.
This article was generated by Benzinga's automated content engine and reviewed by an editor.
Edge Rankings
Price Trend
© 2025 Benzinga.com. Benzinga does not provide investment advice. All rights reserved.
Trade confidently with insights and alerts from analyst ratings, free reports and breaking news that affects the stocks you care about.

