


Amidst today's fast-paced and highly competitive business environment, it is crucial for investors and industry enthusiasts to conduct comprehensive company evaluations. In this article, we will delve into an extensive industry comparison, evaluating Meta Platforms META in comparison to its major competitors within the Interactive Media & Services industry. By analyzing critical financial metrics, market position, and growth potential, our objective is to provide valuable insights for investors and offer a deeper understanding of company's performance in the industry.
Meta Platforms Background
Meta is the largest social media company in the world, boasting close to 4 billion monthly active users worldwide. The firm's "Family of Apps," its core business, consists of Facebook, Instagram, Messenger, and WhatsApp. End users can leverage these applications for a variety of different purposes, from keeping in touch with friends to following celebrities and running digital businesses for free. Meta packages customer data, gleaned from its application ecosystem and sells ads to digital advertisers. While the firm has been investing heavily in its Reality Labs business, it remains a very small part of Meta's overall sales.
| Company | P/E | P/B | P/S | ROE | EBITDA (in billions) | Gross Profit (in billions) | Revenue Growth |
|---|---|---|---|---|---|---|---|
| Meta Platforms Inc | 27.51 | 9.11 | 10.43 | 12.0% | $28.26 | $39.55 | 20.63% |
| Alphabet Inc | 21.52 | 6.49 | 6.15 | 8.3% | $36.5 | $55.86 | 11.77% |
| Baidu Inc | 10.13 | 0.89 | 1.75 | 1.98% | $9.27 | $17.16 | 1.69% |
| Pinterest Inc | 13.56 | 5.17 | 6.93 | 48.33% | $0.27 | $0.96 | 17.62% |
| Kanzhun Ltd | 38.68 | 3.69 | 7.97 | 3.18% | $0.33 | $1.6 | 18.98% |
| ZoomInfo Technologies Inc | 148.75 | 2.41 | 3.55 | 0.87% | $0.02 | $0.26 | -2.31% |
| CarGurus Inc | 162.30 | 6.26 | 3.86 | 8.95% | $0.06 | $0.2 | 2.43% |
| JOYY Inc | 15.28 | 0.52 | 1.40 | 1.17% | $0.06 | $0.21 | -1.48% |
| Weibo Corp | 7.32 | 0.73 | 1.58 | 3.78% | $0.14 | $0.37 | 5.05% |
| Yelp Inc | 17.91 | 2.94 | 1.68 | 5.69% | $0.07 | $0.33 | 5.72% |
| Tripadvisor Inc | 342.25 | 2.04 | 1.08 | 0.11% | $0.03 | $0.41 | 5.38% |
| Ziff Davis Inc | 26.88 | 0.90 | 1.21 | 3.6% | $0.14 | $0.37 | 5.88% |
| Hello Group Inc | 8.06 | 0.85 | 0.96 | 4.03% | $0.56 | $1.05 | -12.1% |
| Average | 67.72 | 2.74 | 3.18 | 7.5% | $3.95 | $6.56 | 4.89% |
Through an analysis of Meta Platforms, we can infer the following trends:
-
A Price to Earnings ratio of 27.51 significantly below the industry average by 0.41x suggests undervaluation. This can make the stock appealing for those seeking growth.
-
The elevated Price to Book ratio of 9.11 relative to the industry average by 3.32x suggests company might be overvalued based on its book value.
-
The stock's relatively high Price to Sales ratio of 10.43, surpassing the industry average by 3.28x, may indicate an aspect of overvaluation in terms of sales performance.
-
The Return on Equity (ROE) of 12.0% is 4.5% above the industry average, highlighting efficient use of equity to generate profits.
-
With higher Earnings Before Interest, Taxes, Depreciation, and Amortization (EBITDA) of $28.26 Billion, which is 7.15x above the industry average, the company demonstrates stronger profitability and robust cash flow generation.
-
The company has higher gross profit of $39.55 Billion, which indicates 6.03x above the industry average, indicating stronger profitability and higher earnings from its core operations.
-
The company is experiencing remarkable revenue growth, with a rate of 20.63%, outperforming the industry average of 4.89%.
Debt To Equity Ratio
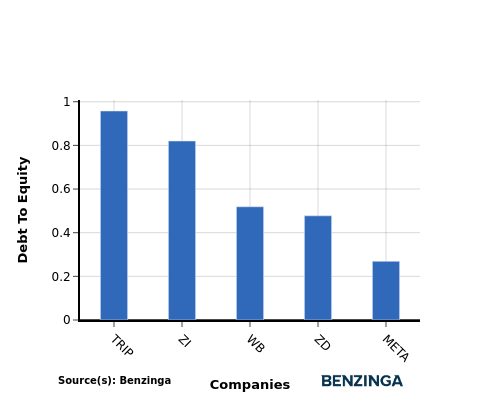
The debt-to-equity (D/E) ratio assesses the extent to which a company relies on borrowed funds compared to its equity.
Considering the debt-to-equity ratio in industry comparisons allows for a concise evaluation of a company's financial health and risk profile, aiding in informed decision-making.
In terms of the Debt-to-Equity ratio, Meta Platforms can be assessed by comparing it to its top 4 peers, resulting in the following observations:
-
Meta Platforms exhibits a stronger financial position compared to its top 4 peers in the sector, as indicated by its lower debt-to-equity ratio of 0.27.
-
This suggests that the company has a more favorable balance between debt and equity, which can be seen as a positive aspect for investors.
Key Takeaways
The PE, PB, and PS ratios for Meta Platforms indicate that it may be overvalued compared to its peers in the Interactive Media & Services industry. However, its high ROE, EBITDA, gross profit, and revenue growth suggest that the company is performing well and has strong financial health relative to its competitors.
This article was generated by Benzinga's automated content engine and reviewed by an editor.
Edge Rankings
Price Trend
© 2025 Benzinga.com. Benzinga does not provide investment advice. All rights reserved.
Trade confidently with insights and alerts from analyst ratings, free reports and breaking news that affects the stocks you care about.

