


In today's fast-paced and competitive business landscape, it is essential for investors and industry enthusiasts to thoroughly analyze companies before making investment decisions. In this article, we will conduct a comprehensive industry comparison, evaluating Meta Platforms META against its key competitors in the Interactive Media & Services industry. By examining key financial metrics, market position, and growth prospects, we aim to provide valuable insights for investors and shed light on company's performance within the industry.
Meta Platforms Background
Meta is the largest social media company in the world, boasting close to 4 billion monthly active users worldwide. The firm's "Family of Apps," its core business, consists of Facebook, Instagram, Messenger, and WhatsApp. End users can leverage these applications for a variety of different purposes, from keeping in touch with friends to following celebrities and running digital businesses for free. Meta packages customer data, gleaned from its application ecosystem and sells ads to digital advertisers. While the firm has been investing heavily in its Reality Labs business, it remains a very small part of Meta's overall sales.
| Company | P/E | P/B | P/S | ROE | EBITDA (in billions) | Gross Profit (in billions) | Revenue Growth |
|---|---|---|---|---|---|---|---|
| Meta Platforms Inc | 24.99 | 8.27 | 9.47 | 12.0% | $28.26 | $39.55 | 20.63% |
| Alphabet Inc | 20.40 | 6.15 | 5.83 | 8.3% | $36.5 | $55.86 | 11.77% |
| Baidu Inc | 10.37 | 0.91 | 1.80 | 1.98% | $9.27 | $17.16 | 1.69% |
| Pinterest Inc | 12.14 | 4.63 | 6.21 | 48.33% | $0.27 | $0.96 | 17.62% |
| Kanzhun Ltd | 41.52 | 4.21 | 8.93 | 3.04% | $0.33 | $1.6 | -4.6% |
| Angi Inc | 22.57 | 0.74 | 0.68 | -0.12% | $0.03 | $0.25 | -10.84% |
| ZoomInfo Technologies Inc | 136.25 | 2.20 | 3.25 | 0.87% | $0.02 | $0.26 | -2.31% |
| CarGurus Inc | 150.55 | 5.80 | 3.58 | 8.95% | $0.06 | $0.2 | 2.43% |
| Weibo Corp | 8.72 | 0.71 | 1.53 | 0.25% | $0.14 | $0.37 | -1.65% |
| Yelp Inc | 19.02 | 3.13 | 1.79 | 5.69% | $0.07 | $0.33 | 5.72% |
| Tripadvisor Inc | 372.25 | 2.22 | 1.18 | 0.11% | $0.03 | $0.41 | 5.38% |
| Ziff Davis Inc | 29.47 | 0.99 | 1.33 | 3.6% | $0.14 | $0.37 | 5.88% |
| Hello Group Inc | 8.56 | 0.68 | 0.84 | 1.66% | $0.56 | $1.05 | -1.43% |
| Average | 69.32 | 2.7 | 3.08 | 6.89% | $3.95 | $6.57 | 2.47% |
By analyzing Meta Platforms, we can infer the following trends:
-
The Price to Earnings ratio of 24.99 is 0.36x lower than the industry average, indicating potential undervaluation for the stock.
-
It could be trading at a premium in relation to its book value, as indicated by its Price to Book ratio of 8.27 which exceeds the industry average by 3.06x.
-
With a relatively high Price to Sales ratio of 9.47, which is 3.07x the industry average, the stock might be considered overvalued based on sales performance.
-
With a Return on Equity (ROE) of 12.0% that is 5.11% above the industry average, it appears that the company exhibits efficient use of equity to generate profits.
-
With higher Earnings Before Interest, Taxes, Depreciation, and Amortization (EBITDA) of $28.26 Billion, which is 7.15x above the industry average, the company demonstrates stronger profitability and robust cash flow generation.
-
The gross profit of $39.55 Billion is 6.02x above that of its industry, highlighting stronger profitability and higher earnings from its core operations.
-
The company's revenue growth of 20.63% exceeds the industry average of 2.47%, indicating strong sales performance and market outperformance.
Debt To Equity Ratio
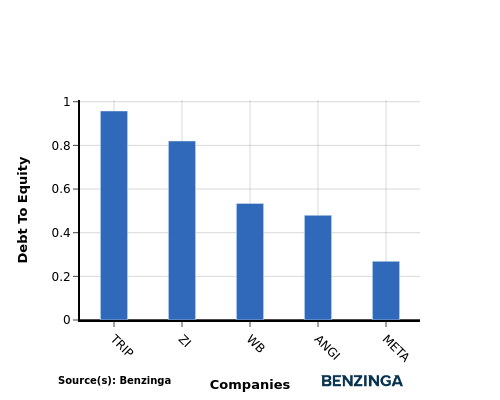
The debt-to-equity (D/E) ratio helps evaluate the capital structure and financial leverage of a company.
Considering the debt-to-equity ratio in industry comparisons allows for a concise evaluation of a company's financial health and risk profile, aiding in informed decision-making.
When comparing Meta Platforms with its top 4 peers based on the Debt-to-Equity ratio, the following insights can be observed:
-
Among its top 4 peers, Meta Platforms has a stronger financial position with a lower debt-to-equity ratio of 0.27.
-
This indicates that the company relies less on debt financing and maintains a more favorable balance between debt and equity, which can be viewed positively by investors.
Key Takeaways
For Meta Platforms, the PE ratio is low compared to peers, indicating potential undervaluation. The high PB and PS ratios suggest strong market sentiment and revenue multiples. In terms of ROE, EBITDA, gross profit, and revenue growth, Meta Platforms outperforms industry peers, reflecting robust financial performance and growth prospects.
This article was generated by Benzinga's automated content engine and reviewed by an editor.
Edge Rankings
Price Trend
© 2025 Benzinga.com. Benzinga does not provide investment advice. All rights reserved.
Trade confidently with insights and alerts from analyst ratings, free reports and breaking news that affects the stocks you care about.

