


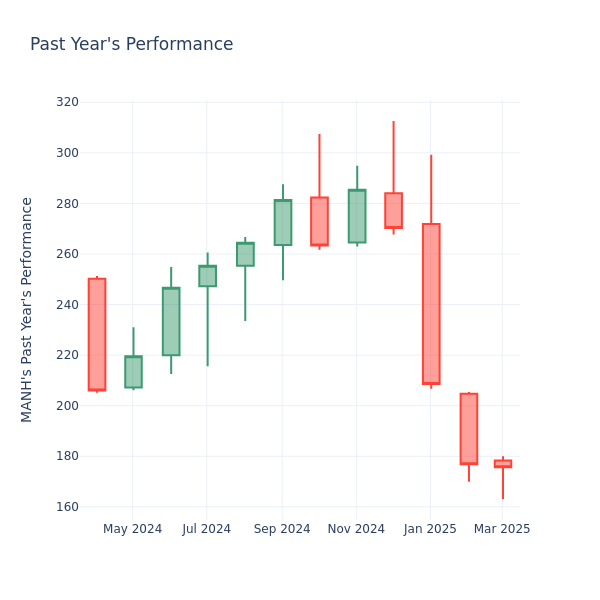
In the current market session, Manhattan Associates Inc. MANH share price is at $175.46, after a 0.09% decrease. Over the past month, the stock increased by 0.27%, but over the past year, it actually fell by 29.07%. With good short-term performance like this, and questionable long-term performance, long-term shareholders might want to start looking into the company's price-to-earnings ratio.
Manhattan Associates P/E Ratio Analysis in Relation to Industry Peers
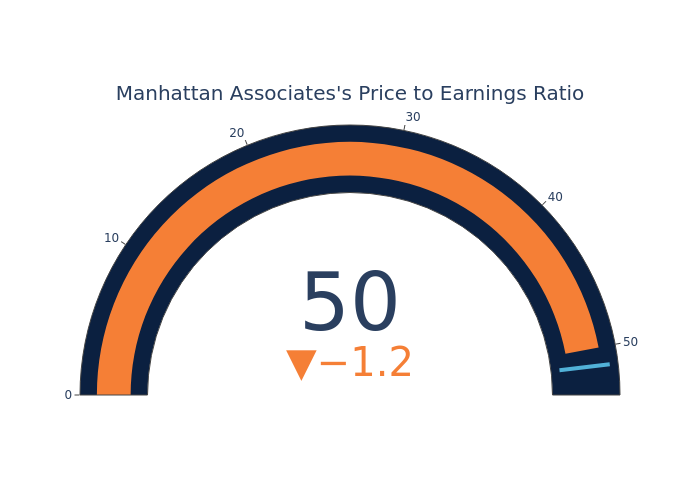
The P/E ratio is used by long-term shareholders to assess the company's market performance against aggregate market data, historical earnings, and the industry at large. A lower P/E could indicate that shareholders do not expect the stock to perform better in the future or it could mean that the company is undervalued.
Compared to the aggregate P/E ratio of the 51.19 in the Software industry, Manhattan Associates Inc. has a lower P/E ratio of 50.03. Shareholders might be inclined to think that the stock might perform worse than it's industry peers. It's also possible that the stock is undervalued.
In summary, while the price-to-earnings ratio is a valuable tool for investors to evaluate a company's market performance, it should be used with caution. A low P/E ratio can be an indication of undervaluation, but it can also suggest weak growth prospects or financial instability. Moreover, the P/E ratio is just one of many metrics that investors should consider when making investment decisions, and it should be evaluated alongside other financial ratios, industry trends, and qualitative factors. By taking a comprehensive approach to analyzing a company's financial health, investors can make well-informed decisions that are more likely to lead to successful outcomes.
Edge Rankings
Price Trend
© 2025 Benzinga.com. Benzinga does not provide investment advice. All rights reserved.
Trade confidently with insights and alerts from analyst ratings, free reports and breaking news that affects the stocks you care about.

