


In today's rapidly evolving and fiercely competitive business landscape, it is crucial for investors and industry analysts to conduct comprehensive company evaluations. In this article, we will undertake an in-depth industry comparison, assessing Microsoft MSFT alongside its primary competitors in the Software industry. By meticulously examining crucial financial indicators, market positioning, and growth potential, we aim to provide valuable insights to investors and shed light on company's performance within the industry.
Microsoft Background
Microsoft develops and licenses consumer and enterprise software. It is known for its Windows operating systems and Office productivity suite. The company is organized into three equally sized broad segments: productivity and business processes (legacy Microsoft Office, cloud-based Office 365, Exchange, SharePoint, Skype, LinkedIn, Dynamics), intelligence cloud (infrastructure- and platform-as-a-service offerings Azure, Windows Server OS, SQL Server), and more personal computing (Windows Client, Xbox, Bing search, display advertising, and Surface laptops, tablets, and desktops).
| Company | P/E | P/B | P/S | ROE | EBITDA (in billions) | Gross Profit (in billions) | Revenue Growth |
|---|---|---|---|---|---|---|---|
| Microsoft Corp | 30.25 | 9.22 | 10.71 | 8.17% | $36.79 | $47.83 | 12.27% |
| Oracle Corp | 32.82 | 23.43 | 7.16 | 19.27% | $5.89 | $9.94 | 6.4% |
| ServiceNow Inc | 116.39 | 17.11 | 15.11 | 4.06% | $0.62 | $2.33 | 21.34% |
| Palo Alto Networks Inc | 96.41 | 17.72 | 14.11 | 4.35% | $0.41 | $1.66 | 14.29% |
| Fortinet Inc | 42.59 | 49.55 | 12.48 | 43.82% | $0.66 | $1.35 | 17.31% |
| Gen Digital Inc | 26.02 | 7.60 | 4.27 | 7.48% | $0.45 | $0.79 | 4.01% |
| Monday.Com Ltd | 392.29 | 11.99 | 13.12 | 2.3% | $0.07 | $0.24 | 32.29% |
| Dolby Laboratories Inc | 29.74 | 3.09 | 5.94 | 2.72% | $0.11 | $0.32 | 13.13% |
| CommVault Systems Inc | 41.56 | 24.14 | 7.57 | 3.9% | $0.02 | $0.21 | 21.13% |
| Qualys Inc | 27.11 | 9.64 | 7.75 | 9.49% | $0.05 | $0.13 | 10.11% |
| SolarWinds Corp | 28.80 | 2.28 | 4.04 | 5.26% | $0.07 | $0.19 | 6.14% |
| Progress Software Corp | 33.44 | 5.05 | 3.04 | 0.27% | $0.05 | $0.18 | 21.47% |
| Teradata Corp | 19.38 | 16.23 | 1.26 | 19.38% | $0.06 | $0.24 | -10.5% |
| Rapid7 Inc | 66.25 | 95.71 | 1.98 | -25.97% | $0.02 | $0.15 | 5.36% |
| Average | 73.29 | 21.81 | 7.53 | 7.41% | $0.65 | $1.36 | 12.5% |
Through a meticulous analysis of Microsoft, we can observe the following trends:
-
With a Price to Earnings ratio of 30.25, which is 0.41x less than the industry average, the stock shows potential for growth at a reasonable price, making it an interesting consideration for market participants.
-
Considering a Price to Book ratio of 9.22, which is well below the industry average by 0.42x, the stock may be undervalued based on its book value compared to its peers.
-
With a relatively high Price to Sales ratio of 10.71, which is 1.42x the industry average, the stock might be considered overvalued based on sales performance.
-
The Return on Equity (ROE) of 8.17% is 0.76% above the industry average, highlighting efficient use of equity to generate profits.
-
The company exhibits higher Earnings Before Interest, Taxes, Depreciation, and Amortization (EBITDA) of $36.79 Billion, which is 56.6x above the industry average, implying stronger profitability and robust cash flow generation.
-
The company has higher gross profit of $47.83 Billion, which indicates 35.17x above the industry average, indicating stronger profitability and higher earnings from its core operations.
-
The company is witnessing a substantial decline in revenue growth, with a rate of 12.27% compared to the industry average of 12.5%, which indicates a challenging sales environment.
Debt To Equity Ratio
The debt-to-equity (D/E) ratio is a measure that indicates the level of debt a company has taken on relative to the value of its assets net of liabilities.
Considering the debt-to-equity ratio in industry comparisons allows for a concise evaluation of a company's financial health and risk profile, aiding in informed decision-making.
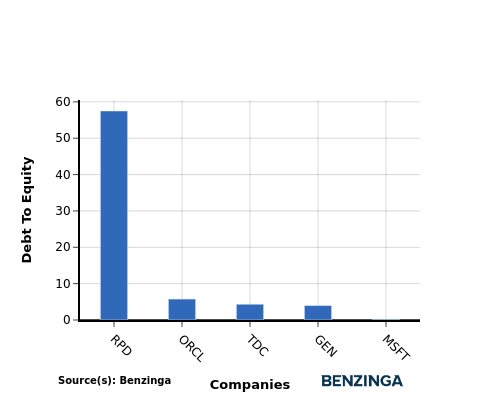
In light of the Debt-to-Equity ratio, a comparison between Microsoft and its top 4 peers reveals the following information:
-
Microsoft exhibits a stronger financial position compared to its top 4 peers in the sector, as indicated by its lower debt-to-equity ratio of 0.21.
-
This suggests that the company has a more favorable balance between debt and equity, which can be seen as a positive aspect for investors.
Key Takeaways
For Microsoft in the Software industry, the PE and PB ratios suggest the company is undervalued compared to its peers, indicating potential for growth. However, the high PS ratio implies that the market values Microsoft's sales more than its earnings or assets. In terms of ROE, EBITDA, and gross profit, Microsoft outperforms its industry peers, reflecting strong profitability and operational efficiency. The low revenue growth rate may indicate a need for strategic initiatives to drive top-line expansion and maintain competitiveness in the sector.
This article was generated by Benzinga's automated content engine and reviewed by an editor.
Edge Rankings
Price Trend
© 2025 Benzinga.com. Benzinga does not provide investment advice. All rights reserved.
Trade confidently with insights and alerts from analyst ratings, free reports and breaking news that affects the stocks you care about.

