


In the fast-paced and cutthroat world of business, conducting thorough company analysis is essential for investors and industry experts. In this article, we will undertake a comprehensive industry comparison, evaluating Meta Platforms META in comparison to its major competitors within the Interactive Media & Services industry. By analyzing crucial financial metrics, market position, and growth potential, our objective is to provide valuable insights for investors and offer a deeper understanding of company's performance in the industry.
Meta Platforms Background
Meta is the largest social media company in the world, boasting close to 4 billion monthly active users worldwide. The firm's "Family of Apps," its core business, consists of Facebook, Instagram, Messenger, and WhatsApp. End users can leverage these applications for a variety of different purposes, from keeping in touch with friends to following celebrities and running digital businesses for free. Meta packages customer data, gleaned from its application ecosystem and sells ads to digital advertisers. While the firm has been investing heavily in its Reality Labs business, it remains a very small part of Meta's overall sales.
| Company | P/E | P/B | P/S | ROE | EBITDA (in billions) | Gross Profit (in billions) | Revenue Growth |
|---|---|---|---|---|---|---|---|
| Meta Platforms Inc | 24.55 | 8.13 | 9.31 | 12.0% | $28.26 | $39.55 | 20.63% |
| Alphabet Inc | 19.74 | 5.95 | 5.64 | 8.3% | $36.5 | $55.86 | 11.77% |
| Baidu Inc | 8.94 | 0.77 | 1.55 | 1.76% | $7.22 | $16.11 | -2.37% |
| Pinterest Inc | 10.54 | 4.02 | 5.39 | 48.33% | $0.27 | $0.96 | 17.62% |
| Kanzhun Ltd | 32.04 | 3.29 | 6.89 | 3.04% | $0.33 | $1.6 | -4.6% |
| CarGurus Inc | 139.65 | 5.38 | 3.32 | 8.95% | $0.06 | $0.2 | 2.43% |
| ZoomInfo Technologies Inc | 107.12 | 1.71 | 2.56 | 0.87% | $0.02 | $0.26 | -2.31% |
| Yelp Inc | 19.01 | 3.12 | 1.79 | 5.69% | $0.07 | $0.33 | 5.72% |
| Weibo Corp | 6.61 | 0.54 | 1.16 | 0.25% | $0.14 | $0.37 | -1.65% |
| Tripadvisor Inc | 314.98 | 1.88 | 1 | 0.11% | $0.03 | $0.41 | 5.38% |
| Ziff Davis Inc | 24.72 | 0.83 | 1.11 | 3.6% | $0.14 | $0.37 | 5.88% |
| Hello Group Inc | 7.27 | 0.58 | 0.71 | 1.66% | $0.56 | $1.05 | -1.43% |
| Average | 62.78 | 2.55 | 2.83 | 7.51% | $4.12 | $7.05 | 3.31% |
After a detailed analysis of Meta Platforms, the following trends become apparent:
-
A Price to Earnings ratio of 24.55 significantly below the industry average by 0.39x suggests undervaluation. This can make the stock appealing for those seeking growth.
-
It could be trading at a premium in relation to its book value, as indicated by its Price to Book ratio of 8.13 which exceeds the industry average by 3.19x.
-
The Price to Sales ratio of 9.31, which is 3.29x the industry average, suggests the stock could potentially be overvalued in relation to its sales performance compared to its peers.
-
With a Return on Equity (ROE) of 12.0% that is 4.49% above the industry average, it appears that the company exhibits efficient use of equity to generate profits.
-
The company has higher Earnings Before Interest, Taxes, Depreciation, and Amortization (EBITDA) of $28.26 Billion, which is 6.86x above the industry average, indicating stronger profitability and robust cash flow generation.
-
With higher gross profit of $39.55 Billion, which indicates 5.61x above the industry average, the company demonstrates stronger profitability and higher earnings from its core operations.
-
The company's revenue growth of 20.63% exceeds the industry average of 3.31%, indicating strong sales performance and market outperformance.
Debt To Equity Ratio
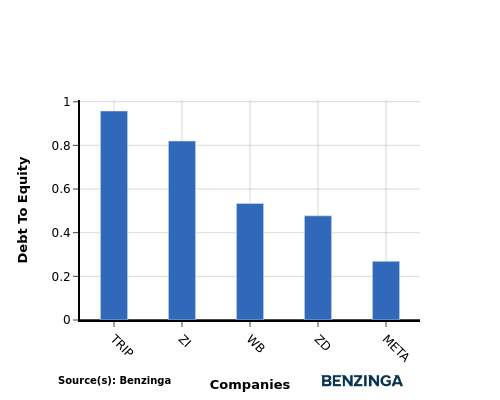
The debt-to-equity (D/E) ratio is a key indicator of a company's financial health and its reliance on debt financing.
Considering the debt-to-equity ratio in industry comparisons allows for a concise evaluation of a company's financial health and risk profile, aiding in informed decision-making.
When examining Meta Platforms in comparison to its top 4 peers with respect to the Debt-to-Equity ratio, the following information becomes apparent:
-
Meta Platforms exhibits a stronger financial position compared to its top 4 peers in the sector, as indicated by its lower debt-to-equity ratio of 0.27.
-
This suggests that the company has a more favorable balance between debt and equity, which can be seen as a positive aspect for investors.
Key Takeaways
The PE, PB, and PS ratios for Meta Platforms indicate that it may be overvalued compared to its peers in the Interactive Media & Services industry. However, its high ROE, EBITDA, gross profit, and revenue growth suggest strong financial performance relative to industry standards. This indicates that while the stock may be expensive based on traditional valuation metrics, the company's operational efficiency and growth potential are favorable.
This article was generated by Benzinga's automated content engine and reviewed by an editor.
Edge Rankings
Price Trend
© 2025 Benzinga.com. Benzinga does not provide investment advice. All rights reserved.
Trade confidently with insights and alerts from analyst ratings, free reports and breaking news that affects the stocks you care about.

