


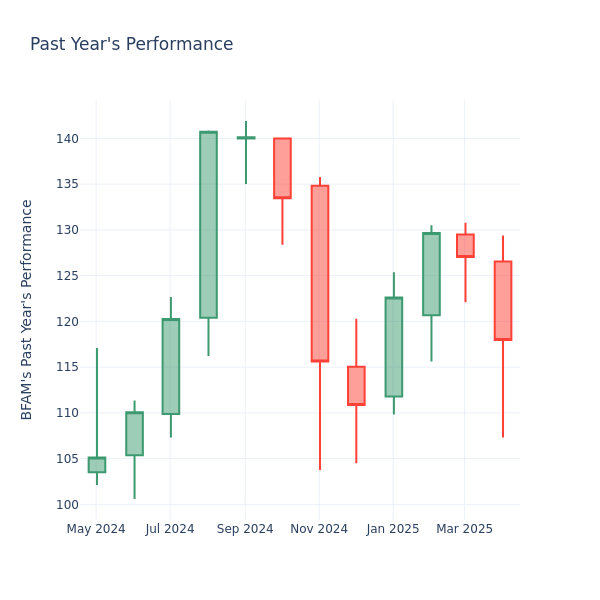
Looking into the current session, Bright Horizons Family Inc. BFAM shares are trading at $117.66, after a 1.55% decrease. Over the past month, the stock decreased by 4.39%, but over the past year, it actually went up by 8.06%. With questionable short-term performance like this, and great long-term performance, long-term shareholders might want to start looking into the company's price-to-earnings ratio.
A Look at Bright Horizons Family P/E Relative to Its Competitors
The P/E ratio is used by long-term shareholders to assess the company's market performance against aggregate market data, historical earnings, and the industry at large. A lower P/E could indicate that shareholders do not expect the stock to perform better in the future or it could mean that the company is undervalued.
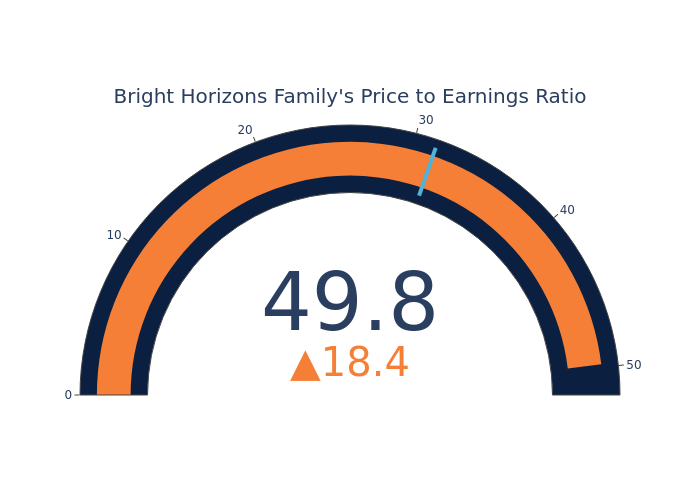
Bright Horizons Family has a better P/E ratio of 49.8 than the aggregate P/E ratio of 31.42 of the Diversified Consumer Services industry. Ideally, one might believe that Bright Horizons Family Inc. might perform better in the future than it's industry group, but it's probable that the stock is overvalued.
In summary, while the price-to-earnings ratio is a valuable tool for investors to evaluate a company's market performance, it should be used with caution. A low P/E ratio can be an indication of undervaluation, but it can also suggest weak growth prospects or financial instability. Moreover, the P/E ratio is just one of many metrics that investors should consider when making investment decisions, and it should be evaluated alongside other financial ratios, industry trends, and qualitative factors. By taking a comprehensive approach to analyzing a company's financial health, investors can make well-informed decisions that are more likely to lead to successful outcomes.
Edge Rankings
Price Trend
© 2025 Benzinga.com. Benzinga does not provide investment advice. All rights reserved.
Trade confidently with insights and alerts from analyst ratings, free reports and breaking news that affects the stocks you care about.

