


In the ever-changing and fiercely competitive business landscape, conducting thorough company analysis is crucial for investors and industry experts. In this article, we will undertake a comprehensive industry comparison, evaluating NVIDIA NVDA and its primary competitors in the Semiconductors & Semiconductor Equipment industry. By closely examining key financial metrics, market position, and growth prospects, our aim is to provide valuable insights for investors and shed light on company's performance within the industry.
NVIDIA Background
Nvidia is a leading developer of graphics processing units. Traditionally, GPUs were used to enhance the experience on computing platforms, most notably in gaming applications on PCs. GPU use cases have since emerged as important semiconductors used in artificial intelligence. Nvidia not only offers AI GPUs, but also a software platform, Cuda, used for AI model development and training. Nvidia is also expanding its data center networking solutions, helping to tie GPUs together to handle complex workloads.
| Company | P/E | P/B | P/S | ROE | EBITDA (in billions) | Gross Profit (in billions) | Revenue Growth |
|---|---|---|---|---|---|---|---|
| NVIDIA Corp | 35.54 | 32.14 | 19.86 | 30.42% | $25.82 | $28.72 | 77.94% |
| Broadcom Inc | 80.84 | 11.76 | 15.44 | 8.01% | $8.54 | $10.14 | 24.71% |
| Taiwan Semiconductor Manufacturing Co Ltd | 21.71 | 5.94 | 8.80 | 9.05% | $596.09 | $512.38 | 38.84% |
| Qualcomm Inc | 14.64 | 5.59 | 3.76 | 11.97% | $4.23 | $6.51 | 17.45% |
| Advanced Micro Devices Inc | 88.29 | 2.49 | 5.61 | 0.84% | $1.69 | $3.88 | 24.16% |
| Texas Instruments Inc | 28.18 | 7.89 | 8.61 | 7.02% | $1.92 | $2.31 | -1.72% |
| ARM Holdings PLC | 132.89 | 16.58 | 29.01 | 4.05% | $0.22 | $0.95 | 19.3% |
| Analog Devices Inc | 56.21 | 2.49 | 9.40 | 1.11% | $1.03 | $1.43 | -3.56% |
| Micron Technology Inc | 16.59 | 1.59 | 2.50 | 3.32% | $3.95 | $2.96 | 38.27% |
| Monolithic Power Systems Inc | 14.34 | 7.99 | 11.61 | 52.73% | $0.17 | $0.34 | 36.93% |
| Microchip Technology Inc | 66.58 | 3.38 | 4.33 | -0.87% | $0.21 | $0.56 | -41.89% |
| STMicroelectronics NV | 12.12 | 1.03 | 1.42 | 1.95% | $0.89 | $1.25 | -22.42% |
| ASE Technology Holding Co Ltd | 18.46 | 1.80 | 0.98 | 2.95% | $30.11 | $26.62 | 1.05% |
| United Microelectronics Corp | 11.86 | 1.47 | 2.41 | 2.28% | $29.73 | $20.43 | -0.16% |
| ON Semiconductor Corp | 9.44 | 1.64 | 2.09 | 4.37% | $0.62 | $0.78 | -14.65% |
| First Solar Inc | 10.35 | 1.67 | 3.18 | 5.05% | $0.58 | $0.57 | 30.68% |
| Skyworks Solutions Inc | 17.19 | 1.34 | 2.23 | 2.54% | $0.31 | $0.44 | -11.07% |
| Credo Technology Group Holding Ltd | 1257.33 | 10.36 | 20.32 | 4.95% | $0.03 | $0.09 | 154.44% |
| Lattice Semiconductor Corp | 94.52 | 8.05 | 11.29 | 2.33% | $0.02 | $0.07 | -31.17% |
| Universal Display Corp | 24.45 | 3.34 | 8.36 | 2.87% | $0.06 | $0.12 | 2.51% |
| Qorvo Inc | 202.93 | 1.57 | 1.44 | 1.22% | $0.14 | $0.39 | -14.67% |
| Average | 108.95 | 4.9 | 7.64 | 6.39% | $34.03 | $29.61 | 12.35% |
When conducting a detailed analysis of NVIDIA, the following trends become clear:
-
The Price to Earnings ratio of 35.54 is 0.33x lower than the industry average, indicating potential undervaluation for the stock.
-
It could be trading at a premium in relation to its book value, as indicated by its Price to Book ratio of 32.14 which exceeds the industry average by 6.56x.
-
The Price to Sales ratio of 19.86, which is 2.6x the industry average, suggests the stock could potentially be overvalued in relation to its sales performance compared to its peers.
-
With a Return on Equity (ROE) of 30.42% that is 24.03% above the industry average, it appears that the company exhibits efficient use of equity to generate profits.
-
The Earnings Before Interest, Taxes, Depreciation, and Amortization (EBITDA) of $25.82 Billion is 0.76x below the industry average, suggesting potential lower profitability or financial challenges.
-
The company has lower gross profit of $28.72 Billion, which indicates 0.97x below the industry average. This potentially indicates lower revenue after accounting for production costs.
-
The company's revenue growth of 77.94% is notably higher compared to the industry average of 12.35%, showcasing exceptional sales performance and strong demand for its products or services.
Debt To Equity Ratio
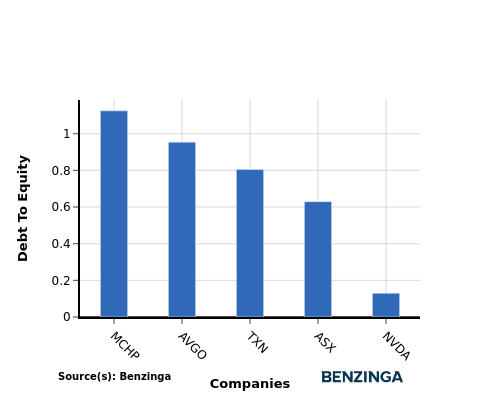
The debt-to-equity (D/E) ratio gauges the extent to which a company has financed its operations through debt relative to equity.
Considering the debt-to-equity ratio in industry comparisons allows for a concise evaluation of a company's financial health and risk profile, aiding in informed decision-making.
When assessing NVIDIA against its top 4 peers using the Debt-to-Equity ratio, the following comparisons can be made:
-
NVIDIA has a stronger financial position compared to its top 4 peers, as evidenced by its lower debt-to-equity ratio of 0.13.
-
This suggests that the company has a more favorable balance between debt and equity, which can be perceived as a positive indicator by investors.
Key Takeaways
The PE, PB, and PS ratios for NVIDIA are indicating that the stock is relatively undervalued compared to its peers in the Semiconductors & Semiconductor Equipment industry. On the other hand, the high ROE, low EBITDA, low gross profit, and high revenue growth suggest that NVIDIA is performing well and has strong growth potential within the industry sector.
This article was generated by Benzinga's automated content engine and reviewed by an editor.
Edge Rankings
Price Trend
© 2025 Benzinga.com. Benzinga does not provide investment advice. All rights reserved.
Trade confidently with insights and alerts from analyst ratings, free reports and breaking news that affects the stocks you care about.

