

This is the question people want answers to. However, most lack the understanding of how to establish a bias toward the stock market.
As a consequence, people turn to social media in hope of finding answers. Many find out that the online world is where the blind lead the blind. I have even seen comments to the effect of I am happy to lose money as long as we are losing money together.
It is a sad state of affairs.
Observe the masses and do the opposite. Go against the infectious herd mentality that is the downfall of far too many. That is precisely how good investors make consistent growth from the financial markets.
Instead of turning to the noise and misinformation on social media, embrace the following two proven indicators to establish how bullish or bearish the stock market is.
Indicator 1
The first indicator is one I have repeatedly highlighted in my articles is the daily 200 simple moving average (d200sma) on the S&P 500.
- If the price is above the d200sma, we have a bullish bias, and we look for long opportunities.
- If the price is below the d200sma, we have a bearish bias, and we look to short the market.
Good investors do not go against this logic. Institutions also use this logic originated from old-school traders who drew charts by hand. I go into detail in this article on why the 200sma.
Indicator 2
The second indicator is one that builds on the use of the d200sma is the percentage of stocks trading above their respective d200sma.
Below I have the chart that displays this data.
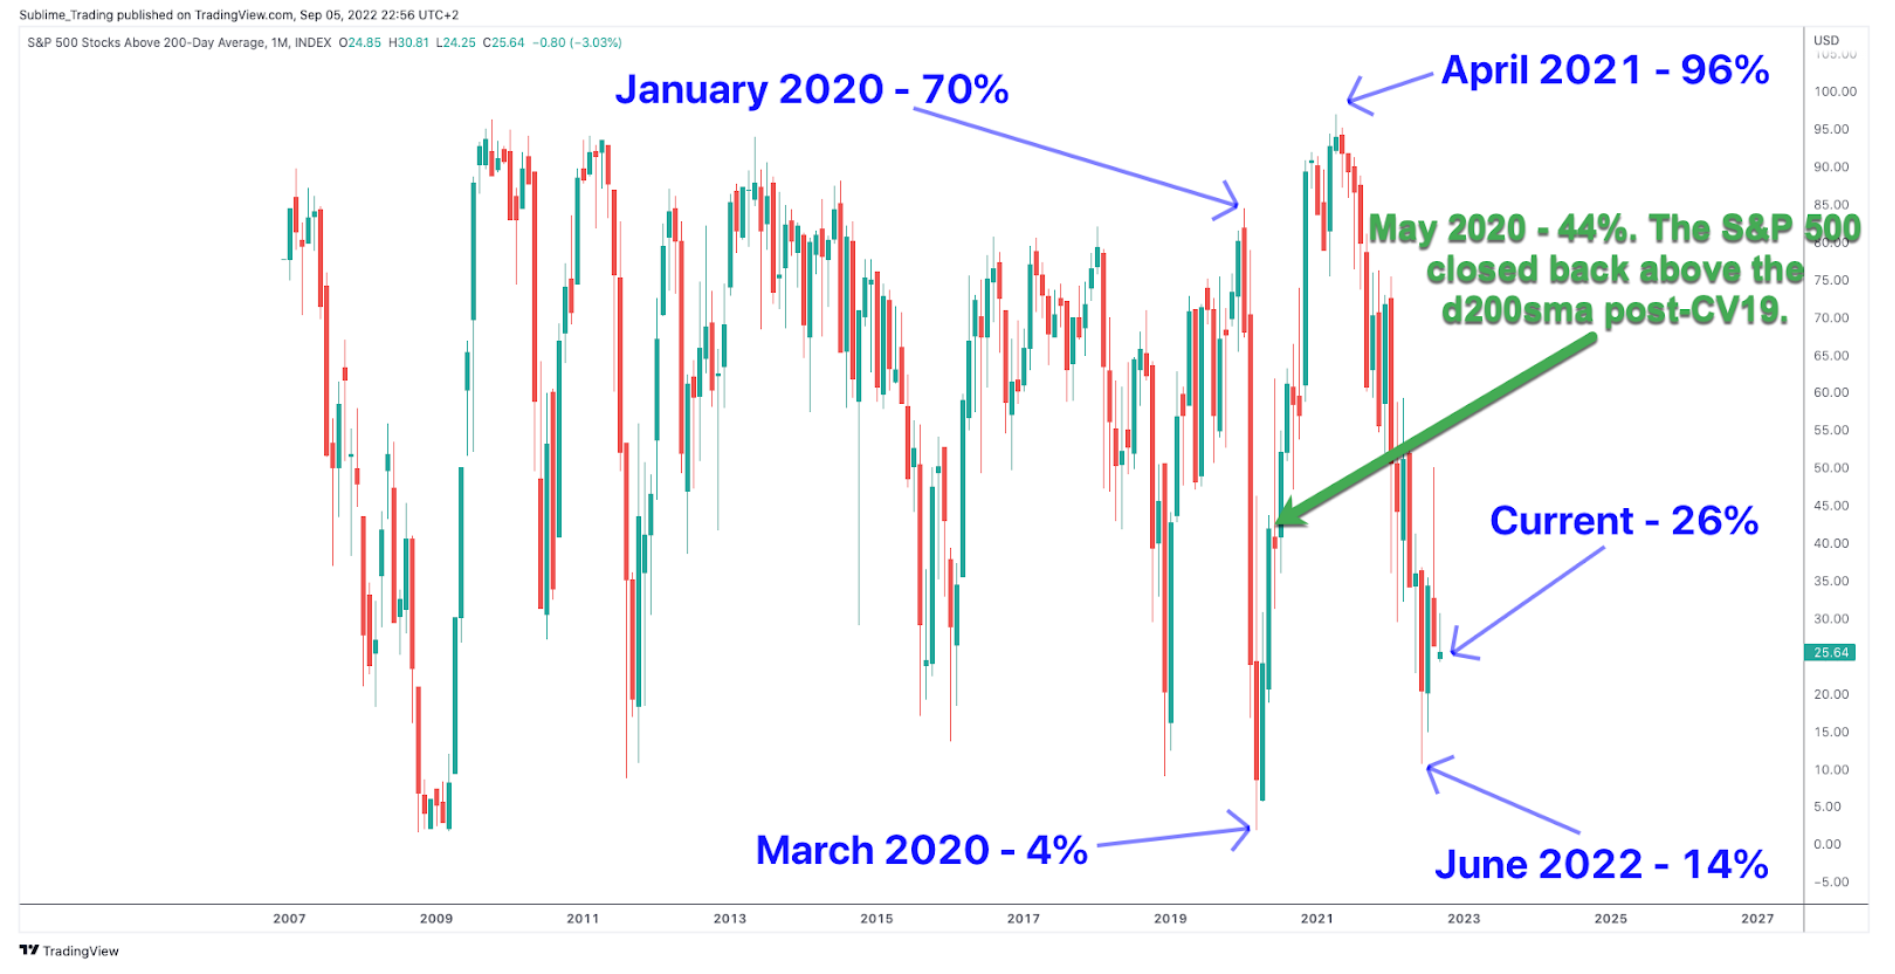
Let's look at some of the numbers.
- Before the declines caused by CV19 in January 2020, 70% of stocks were trading above their d200sma.
- At the bottom of the drop in March 2020, 5% of stocks were trading above their d200sma.
- At the market's peak post-CV19 in April 2021, 92% of stocks were trading above their d200sma.
- At the time of writing (Labor Day 2022), 26% of stocks are trading above their d200sma, an increase from 14% at the low of June 2022.
How to use this data?
I use it in conjunction with the price action on the S&P 500 to establish a high-probability environment to start buying stocks outperforming the index.
- I first wait for the price to confirm a bull trend above the d200sma on the S&P 500. At this point, the number of stocks trading above their d200sma will steadily increase.
- Second, depending on how aggressive you want to be, in your trading plan you want to add a percentage of stocks trading above their d200sma before taking a position. For example, 44% of stocks were trading above their d200sma by the end of May 2020 once the S&P 500 moved back above its d200sma post-CV19.
Once the two marry up, the S&P 500 confirming a bull trend above its d200sma and the right percentage of stocks trading above its d200sma, you have the required data to identify a bull market and to start buying the strongest performing stocks.
At this point, there is no guarantee that the market will continue to climb. Investing is a game of probabilities. Using the above method, we establish environments where we have more chance of making a profit than a loss. However, there is no guarantee of profit and where a strategy comes in with specific exit and risk management criteria.
To help you select stocks out-performing the index, I go into detail in this article on the checklist system I use to identify stocks that display an edge, in other words, the highest probability of success.
My current stance
For now, with the S&P 500 trading below its d200sma and only 26% of stocks trading above their d200sma, I continue to apply patience and stand aside.
Remember, standing aside and protecting capital is also a position, a hallmark of a solid investor when executed impeccably.
Image sourced from Shutterstock
© 2025 Benzinga.com. Benzinga does not provide investment advice. All rights reserved.
Trade confidently with insights and alerts from analyst ratings, free reports and breaking news that affects the stocks you care about.

