
(Friday Market Open) The last day of an ugly stock market quarter is finally here, with stocks nursing their wounds after Wednesday’s rally got wiped out in a tidal wave of Thursday selling. The S&P 500® (SPX) sputtered to another new 2022 low yesterday amid heavy selling across the entire range of S&P sectors.
The SPX is on pace for its third-straight losing quarter, something that hasn’t happened since the 2008-2009 recession. While stock futures made some small gains and then flattened before Friday’s opening bell as Treasury yields softened, it’s just hard to get excited about rallies when they keep getting sold off.
For many investors, uncertainty in the markets is turning to outright pessimism, never a good thing for risk assets.
It also doesn’t help that shares of Nike (NYSE: NKE) are getting stepped on, down 10% ahead of the opening bell despite the company beating on both earnings and revenue in its latest quarter. Inventory and supply chain issues, which one NKE executive called “a new degree of complexity,” continue to dog the company, along with a soft market in China.
Potential Market Movers
The SPX is down around 4% so far in Q3, which doesn’t sound too terrible until you see it’s off nearly 16% from its quarterly high posted in mid-August. It’s been a volatile week, with a lot to digest for a market already on edge about what’s going to be coming down the pipeline this earnings season.
Some of the biggest growth companies, including Apple (NASDAQ: AAPL), Meta (NASDAQ: FB), Microsoft MSFT, Alphabet (NASDAQ: GOOGL), and Nvidia (NASDAQ: NVDA), are now approaching their respective 52-week lows, many of which were posted in June. If those lows can’t hold, it could conceivably drive even more selling. Consider monitoring those growth company lows over the next few sessions to see if they stay in place because that could provide clues about where the market goes next.
The quarter won’t be over until investors digest some important data just out this morning. The Fed’s favorite inflation monitor, the Personal Consumption Expenditures (PCE) price index for August, came out before the open, showing a headline rise of 0.3% and a core gain of 0.6%. Core prices (not including food or energy) are now up 4.9% year-over-year, up from 4.7% in July.
You don’t need a road map to know that’s the wrong direction.
That compared to Wall Street’s consensus expectations for 0.2% headline PCE inflation, 0.4% core PCE, and July’s figures of negative 0.1% and 0.1%, respectively. So, the report seems likely to reinforce the Fed’s ideas that inflation is far from being tamed. It also sends a message that the Fed’s higher rates aren’t having a big impact yet.
The PCE data also showed August personal spending hotter than expected. Stocks ticked down slightly after the data, but the big report to watch today is University of Michigan consumer sentiment later this morning. Keep an eye on inflationary expectations in that one.
Next week’s data is all about jobs and manufacturing. Everything builds up to next Friday’s September payrolls report, which we’ll preview in more detail next week.
There’s also the data on monthly job openings and a key look at the health of the U.S. manufacturing industry. While data takes the headlines, the earnings picture looks a bit dull to start October, but that picks up in a big way later in the month.
As the monthly jobs report looms, remember the adage about “good news being bad news.” At least through August, jobs growth showed no sign of any slowdown due to rising rates. Though it’s normally nice to see powerful gains in the job market, investors may get nervous if next Friday’s report shows another 300,000 or more jobs added it could help cement the Fed’s determination to keep following through with big rate hikes.
As of late this week, the CME FedWatch Tool showed a 60.2% probability of a fourth straight 75-basis-point hike in November versus a 39.8% chance of just a 50-basis-point increase. The chance of a 75-basis-point hike is down from a week ago but up slightly from yesterday.
Reviewing the Market Minutes
Major indexes plunged to new lows for 2022 on Thursday as inflation concerns and sharp losses in AAPL drove selling.
The S&P 500 (SPX) fell more than 2% to a fresh closing low for the year of 3,640, not far off its softest point of the day. The Nasdaq® (COMP) took a worse hit of 2.8%, thanks partly to AAPL and general weakness across the information technology sector. The small-cap Russell 2000® (RUT) finished in between with a 2.5% loss.
AAPL and its nearly $2.3 trillion market cap put pressure on the information technology sector and the major indexes as its shares plunged to nearly three-month lows. AAPL shares fell after a downgrade from Bank of America (BAC) following reports that AAPL saw falling demand for iPhones.
When AAPL coughs, the market often gets the flu, thanks to the SPX being a market cap-weighted index and AAPL having the largest market cap in the SPX. Basically, big moves in AAPL and other large stocks like MSFT swing a lot of weight in how the SPX performs on any given day.
Also in the tech sector, shares of chip-maker Micron (MU) rose just a tad ahead of the opening bell, despite the company’s revenue missing analysts’ estimates in its latest quarter. Earnings per share came in better than analysts had expected, but guidance appeared to disappoint the Street amid signs of falling consumer demand for products that use chips. The good news for MU happened a bit after it reported, when Japan gave MU up to $320 million to make chips at a plant in the country. MU shares are down 46% for the year.
Surprisingly, some of the market’s biggest “fear factors” like the Cboe Volatility Index® (VIX), 10-year Treasury yield, and U.S. Dollar Index ($DXY) all were off recent highs Thursday, which normally would seem to indicate a little less weight on the stock market. The dollar softened Thursday, so that’s something if you’re looking for one bit of cheer. The 10-year yield fell back to 3.7% this morning, near its low for the week.
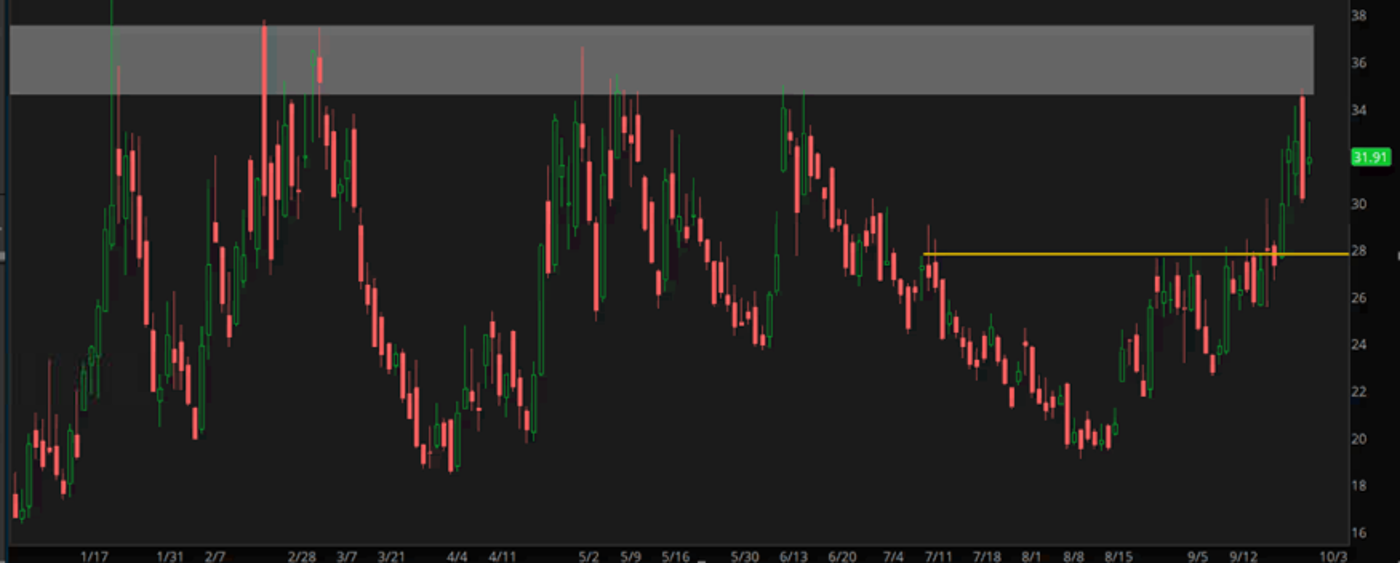
CHART OF THE DAY: DANGER AHEAD? The VIX (candlesticks) is fast approaching some dangerous chart territory. The rectangular area just above current levels represents an important resistance range between roughly 35 and 37 compared with highs so far this week in the 32 to 33 range. The VIX is approaching levels last seen in June and before that in early spring; a push above this range could be another pressure point on stocks. Data Source: Cboe®. Chart source: the thinkorswim® platform. For illustrative purposes only. Past performance does not guarantee future results.
Three Things to Watch
FLOW METER: Institutional investors went heavy into cash in Q2, making it the third quarter in a row they reduced exposure to non-cash strategies. Nasdaq said in a recent report that high-yield fixed income saw the biggest outflows, perhaps a sign of investors gravitating away from risk. But long-term bonds saw the biggest inflows, which could help explain why the yield curve inverted.
As a reminder, an inverted yield curve means shorter-term fixed income assets have higher yields than longer-term ones, which is the opposite of the historical norm. This sometimes indicates investor worries about the health of the economy, characterized by a move into what they perceive as “safer” low-yielding long-term bonds rather than stocks. The 30-year Treasury yield recently traded at a more than 40-basis-point discount to the 2-year Treasury note. Data for Q3 isn’t available yet; however, judging from how the bond market behaved in September—with the yield curve inversion getting even steeper—the same trend may have continued.
VALUATION ELEVATION? If you’re still feeling bullish as this rocky month winds down, it may be disappointing to hear that the market’s current valuation remains historically elevated—even after setting new 2022 lows this week. The forward price-to-earnings (P/E) ratio on the SPX recently checked in at approximately 16. That’s down from highs above 20 a year ago but not as low as at the bottom of the market during COVID-19. Earnings season approaches with Wall Street’s estimates generally on a downward path. If estimates continue to fall as companies report and deliver fresh guidance, the current SPX price, even if it doesn’t rebound much from current levels, might start to look expensive.
Q3 CONVERSATION: The end of any quarter is a good time to take another look at your investments and how they performed over the last three months. After you’ve wiped away the tears, take out any investment plan you may have filed away earlier this year and look it over. Are your allocations still where you planned them to be? The sliding stock market may mean your portfolio is now too heavily weighted toward fixed income, cash, or alternative investments.
While this isn’t a good time to go all in on stocks, ask yourself if you’re comfortable increasing your investment in quality companies whose stocks have simply fallen with the rest of the market. If you still believe in a company and the overall economy, getting in at a lower price is one advantage you might have at this point. As a long-term investor, these are tough times. It’s not fun to watch your accounts fall. On the other hand, this bear market doesn’t mean you need to necessarily change your strategy if your long-term goals remain the same. Many analysts will say it’s best to buckle down if you have many years of investing ahead because selling out of emotion during times like these tends to turn out badly for many investors.
Notable Calendar Items
Oct. 3: September ISM Manufacturing PMI
Oct. 4: August JOLTS job openings, August Factory Orders, and earnings from Acuity Brands (AYI)
Oct. 5: September ADP Nonfarm Employment, September ISM Non-Manufacturing Index, and Trade Balance
Oct. 6: Earnings from Conagra (CAG) and McCormick (MKC)
Oct. 7: Nonfarm Payrolls, Wholesale Inventories, and earnings from Tilray (TLRY)
Oct. 11: Earnings from PepsiCo (PEP)
TD Ameritrade® commentary for educational purposes only. Member SIPC.
Image sourced from Shutterstock
This post contains sponsored advertising content. This content is for informational purposes only and not intended to be investing advice.
© 2025 Benzinga.com. Benzinga does not provide investment advice. All rights reserved.
Trade confidently with insights and alerts from analyst ratings, free reports and breaking news that affects the stocks you care about.

