


(Monday Market Open) There’s a bit of a pullback this morning following the biggest one-week rally in five months, but nothing terribly earth-shattering in the news. Most of the metrics that fell last week moved higher today, putting the brakes on Wall Street.
Beyond that, we’ve got a busy week ahead packed with earnings, Fed speakers, and inflation and spending data. The holidays may be approaching fast, but get ready for at least another few days of possible choppiness as traders consider what’s next.
Potential Market Movers
After last week’s rate-related optimism, Treasury yields advanced following hawkish weekend words from Fed Governor Christopher Waller. He sounded resolute on rate hikes, saying “we’ve still got a ways to go,” adding that last week’s softer-than-expected Consumer Price Index (CPI) report was “just one data point.”
Waller’s words may also be sending the U.S. Dollar Index ($DXY) a bit higher this morning, but it’s still below 107, down dramatically over the last week.
That’s not the last word from the Fed this week. Far from it. Two more Fed speakers are scheduled today, and every day this week features at least one. Treasury yields could show some choppiness amid all the “Fed speak” in coming days. The dollar could also swing back and forth as Fed speakers opine.
While retail earnings grab most of the attention this week, tech came into the spotlight this morning with Advanced Micro Devices AMD shares climbing on an analyst upgrade. Semiconductors could headline Wednesday afternoon when Nvidia NVDA is expected to report earnings. Info tech got a lift last week as “risk-on” sentiment kicked back into gear, but NVDA’s earnings look like another tech touchpoint.
Geopolitics is also back on the market’s mind as President Biden met with China’s President Xi, and as the International Monetary Fund (IMF) put out a gloomy report on the global economic outlook. OPEC lowered its projections for crude demand, helping push WTI Crude futures (/CL) down 1%.
Keep Watching the VIX
Though the Cboe Volatility Index® (VIX) remains below 25 this morning, you’ll definitely want to monitor it over the week ahead.
- In late October and early November, the VIX was dropping along with stocks, which isn’t in line with historic precedent. Usually, volatility rises in a falling stock market, so the VIX’s disagreement with major indexes is telling you something is off.
- Now things appear to be back in sync, but that only means the VIX is even more vital. If stocks continue rallying but the VIX ticks higher, consider extra caution in going long on stocks. The VIX might be trying to tell you something, and this might be particularly true when the October Producer Price Index (PPI) data arrives tomorrow morning before the open.
Last week’s softer-than-expected October Consumer Price Index (CPI) was definitely a mood changer on Wall Street, but it was certainly not the last word in inflation data before the Federal Reserve’s next rate meeting in mid-December. Sentiment has swung back and forth dramatically in recent days and weeks, which means hotter-than-expected readings tomorrow could send the market pendulum swinging in the opposite direction. It’s one more reason anyone trading should be more cautious than usual.
In September, the headline PPI rose 0.4% and core PPI climbed 0.3%. Investors (and possibly the Fed) are probably going to want to see progress to the downside on both indicators tomorrow to reinforce the bullish CPI data from last week. Again, watch the VIX once that data comes out.
Michigan Sentiment Turns Sour
On Friday, November preliminary University of Michigan Consumer Sentiment data came in well below expectations. The headline figure of 54.7 was the lowest since July and not far above recent four-decade lows. This doesn’t bode well for the retail sector as such leading names as Walmart WMT, Lowe’s LOW, Home Depot HD, Macy’s M, Gap GPS, and Target TGT are expected to report Q3 earnings this week.
Weak consumer sentiment typically indicates shoppers are less willing to open their wallets. Investors may want to follow updates on the annual post-Thanksgiving shopping weekend to see if spending indications are a bit lighter. The U of M data is just the latest in a long line of news events and reports pointing toward possibly softer holiday spending. As a result, many retailers haven’t hired as many holiday staffers as they did a year ago.
WMT plans to hire just 40,000 part-time workers versus 150,000 last year. Other major retailers reportedly hiring fewer season employees include Dick’s Sporting Goods DKS and Macy’s, according to Women’s Wear Daily, a trade journal. TGT and Amazon AMZN are keeping seasonal holiday hires at the same level as last year. However, AMZN put a freeze on corporate hiring last week due to what it said were “uncertain” economic conditions.
- Another key element to watch when big-box retailers report is their inventory picture. Over the last few months, many retailers have struggled with merchandise levels after ordering heavily to meet expected post-pandemic demand. Compounding the problem, easing supply chain snags also led to a further pileup of goods. Overstocked shelves and warehouses have driven a lot of price-cutting expected to pressure Q3 profit margins.
- However, the industry-wide impact of inventory and price cuts could be hard to forecast. Most analysts believe these challenges will be company-specific and have a greater impact on individual stocks than the retail sector as a whole.
- As far as Q3 earnings across industries, research firm FactSet still expects Q3 S&P earnings growth of 2.2%, the lowest in two years. About 91% of S&P companies have reported so far this earnings season—; 69% beat analysts’ earnings expectations while 71% beat analysts’ revenue expectations. These aren’t very compelling percentages compared with other recent quarters, and the size of earnings beats has also fallen. Companies issuing negative Q4 guidance outnumber ones issuing positive guidance by a more than 2:1 margin, according to FactSet.
- Another thing to contend with: Last week’s stock market rally brought the forward price-earnings (P/E) ratio for the S&P 500® (SPX) to 17.1, FactSet reported. That’s equal to the 10-year average. If you think earnings can grow solidly in 2023, maybe you’ll be comfortable with the current P/E. But if you expect a recession, you have to calculate potential earnings losses into stock prices, which means the current P/E might be too high. If the “E” element falls, you might see a downward adjustment to “P” as well.
Walmart, Home Depot Report Tomorrow
Some thoughts ahead of WMT and HD earnings:
WMT has around 400 stores in China, making it highly exposed to a slowing economy there and to declining relations between Washington and Beijing. Supply chain issues related to China are also a potential drag. When you look at WMT’s Q3 sales, keep in mind the impact higher inflation can have on sales growth. Higher prices can make revenues look better than they really were. It’s important to distinguish what’s organic from what’s inflation-related across the retail space. Also, keep an eye on WMT’s apparel business, which has been soft, and watch its inventories overall, which were up 25.6% in Q2 versus a year earlier. Any sign of improvement there could suggest WMT has gotten control of excess merchandise and markdowns.
Home Depot (HD): Things looked rosier at HD in Q2 than at LOW. Both sales and earnings per share beat expectations, and the company forecasted strong guidance amid firm home improvement demand. Obviously, the question is whether that still holds true as consumers struggle with inflation. Same-store year-over-year sales beat analysts’ expectations in Q2 with a nearly 6% rise, but HD hinted that could be hard to match in coming quarters. For both LOW and HD, there’s concern that the burst of pandemic home improvement demand amid people being stuck at home and government stimulus might be winding down.
Reviewing the Market Minutes
The S&P 500 index (SPX) made a late run Friday toward the psychological 4,000 mark, coming within a point with less than 10 minutes of trading left, only to fall short. It did briefly top 4,000 at one point, the first time that’s happened in two months. Failure to take out that level doesn’t detract from an amazing week. The benchmark SPX rose nearly 6% for the week—its best week since June—despite suffering a major sell-off Wednesday amid crypto-related fears.
Here’s how the major indexes performed Friday:
· The Dow Jones Industrial Average® ($DJI) increased 33 points to 33,749.18.
· The Nasdaq Composite® ($COMP) climbed 209.18, or 1.88%, to 11,323.33.
· The Russell 2000® (RUT) rose 18.31, or 0.98%, to 1,886.12.
· The SPX gained 36.55, or 0.92% to 3,992.9.
“Risk-on” continued during Friday’s session. Sectors like consumer discretionary, info tech, and communication services all finished near the top. These are sectors that tend to do better when economic times improve. Defensive sectors like staples, utilities, and health care brought up the rear on Friday and were close to the bottom in weekly performance, a sign, according to some analysts, that sector rotation may be moving from so-called “flight-to-safety” asset toward more aggressive Investments.
At the same time, Treasury yields declined sharply last week, a sign of buying interest in fixed income too. It’s odd to see stocks and bonds rising at the same time, but the bond strength probably reflects hopes that the Federal Reserve might finally be close to backing off aggressive rate hikes if inflation continues benign.
That’s not something anyone should necessarily count on, but we’ll know more when this week is over.
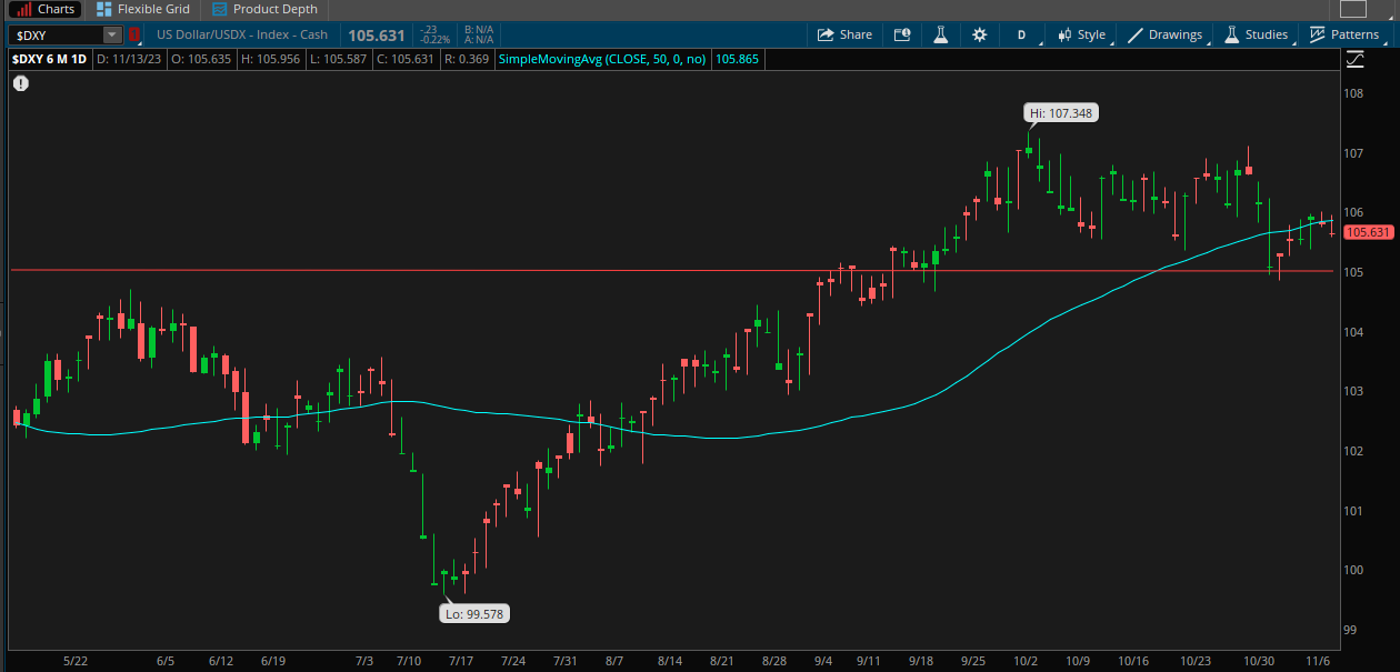
CHART OF THE DAY: The S&P 500 index (SPX—candlesticks) climbed above its 100-day moving average (blue line) late last week but remains below its 200-day moving average (red line). Technically, its ability now to set a floor by not falling below the 100-day moving average would be constructive, but remember, many analysts still think this is a bear market rally. However, if SPX climbs above its 200-day moving average, that might reset that thinking. Data source: S&P Dow Jones Indices. Chart source: The thinkorswim® platform. For illustrative purposes only. Past performance does not guarantee future results.
Three Things to Watch
Rotation and the Indexes: Though many investors use the Dow Jones Industrial Average ($DJI) to track the whole market, Friday provided more evidence of why it’s an inadequate gauge. While other major indexes rose Friday morning, the $DJI fell at the open. Why? Health care weakness played a role as investors appeared to rotate out of defensive stocks and back into more growth-oriented areas, according to Brieing.com. That development didn’t move the SPX much in part because it contains 500 stocks. But because there are only 30 stocks in the $DJI, its health care components caused the entire index to waver. One more point about the $DJI—it’s not a market-cap weighted index, meaning its biggest market-cap members don’t move the index any more than the smallest. So, Apple’s (AAPL) $2 trillion market cap isn’t treated any differently than Amgen’s (AMGN) $150 billion market cap. By contrast, the bulkiest heavyweights in the SPX swing more influence than the welterweights on the headline price. Why say all this? Just as a reminder that the Dow shouldn’t be the only way you follow the market.
Smaller Packages? A Bank of America (BAC) survey reported that consumers may spend less this holiday season because overall consumer spending growth continued to slow in October. Discretionary spending “has shifted into a slower lane” led by lower-income households earning less than $50,000 per year. BAC’s research arm said that in October discretionary spending per household rose 2.9% year over year, down from 3.2% in September. However, services spending continued to outperform weaker goods spending over the same period. This echoes a trend we’ve been hearing about quite a bit—that if consumers are opening their wallets, they’re doing so to catch up on “experiences” they’ve missed since the pandemic lockdowns.
Buyback Comeback, Continued: For a while now, we’ve been talking about next year’s new 1% federal excise tax on corporate stock buybacks as a spark plug for firms to get stock repurchase programs wrapped up by the end of the year. FactSet wonders if a relatively mixed Q3 earnings season might also drive such moves after what’s referred to as the “buyback blackout period,” which is said to occur just before the end of a reporting period through two days after it releases quarterly results. The current earnings period ends in a couple of weeks, so it’s a prime time to pay attention. With the tax change and the earnings season timing, FactSet sees a potential “Santa Claus rally” in repurchases that could beat 2021’s record $900 billion year. If you’d like to learn more about how buybacks work, watch here.
Notable Calendar Items
Nov. 15: October Producer Price Index (PPI), November Empire State Manufacturing, and expected earnings from Home Depot (HD) and Walmart (WMT)
Nov. 16: October Retail Sales and Industrial Production, and expected earnings from Lowe’s (LOW) and Target (TGT)
Nov. 17: October Housing Starts and Building Permits, November Philadelphia Fed Index, and expected earnings from Alibaba Group (BABA), Kohl’s (KSS), and Macy’s (M)
Nov. 18: October Existing Home Sales and expected earnings from Foot Locker (FL) and JD.com (JD)
Nov. 21: Expected earnings from Dell (DELL) and Zoom Video (ZM)
Nov. 22: Expected earnings from Best Buy (BBY), Autodesk (ADSK), Dick’s Sporting Goods (DKS), Dollar Tree (DLTR), Medtronic (MDT), and Baidu (BIDU)
Nov. 23: November Final University of Michigan Sentiment, October Durable Orders, October New Home Sales, and expected earnings from Deere (DE)
Nov. 24: Markets closed for Thanksgiving, reopening November 25. Have a great holiday!
Image sourced from Shutterstock
This post contains sponsored advertising content. This content is for informational purposes only and not intended to be investing advice.
Edge Rankings
Price Trend
© 2025 Benzinga.com. Benzinga does not provide investment advice. All rights reserved.
Trade confidently with insights and alerts from analyst ratings, free reports and breaking news that affects the stocks you care about.

