


Originally published at volumeleaders.substack.com


Weekly Wrap-Up
During the week of July 29 through August 2, 2024, the U.S. financial markets faced a tumultuous period marked by significant volatility and mixed economic signals. Major indices, including the S&P 500, Dow Jones Industrial Average, and Nasdaq, experienced notable declines, driven by concerns over an economic slowdown and disappointing corporate earnings.
The week began with a focus on corporate earnings, with several high-profile companies releasing their quarterly results. Meta Platforms, Amazon, and Intel were among the notable names. Meta reported better-than-expected earnings, driven by strong ad revenue growth and continued expansion in its virtual reality segment. However, Amazon's results were disappointing, with the company missing revenue estimates and providing a weaker-than-expected outlook. This sent Amazon's stock tumbling, contributing to broader market declines. Intel also faced a challenging week, as the company announced significant job cuts and provided a gloomy outlook, leading to a sharp drop in its stock price.
Geopolitical tensions further exacerbated market jitters, particularly the assassination of a prominent Hamas leader, which heightened concerns about stability in the Middle East. This geopolitical development led to a rush into safe-haven assets, with U.S. Treasury yields falling significantly. The yield on the 10-year Treasury note dropped to its lowest level since December 2023, reflecting investor anxiety and a flight to safety.
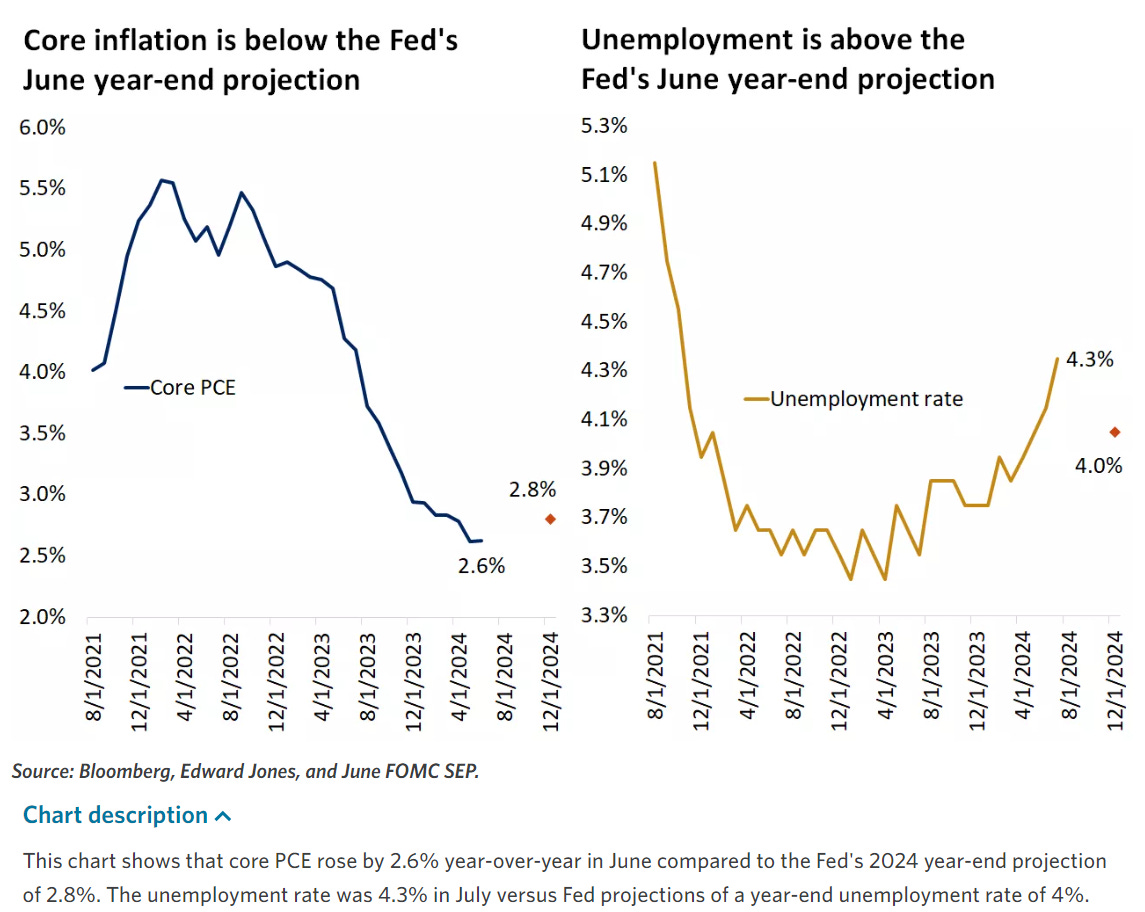
Economic data released during the week added to the market's concerns. The U.S. jobs report for July showed a significant slowdown in job creation, with nonfarm payrolls increasing by just 114,000, well below expectations. The unemployment rate rose to 4.3%, the highest level in over a year, indicating a potential softening in the labor market. The report also showed a modest increase in hourly earnings, suggesting limited wage pressures. These data points led to increased speculation about a potential rate cut by the Federal Reserve, as markets began to price in a greater likelihood of monetary easing to support the economy.
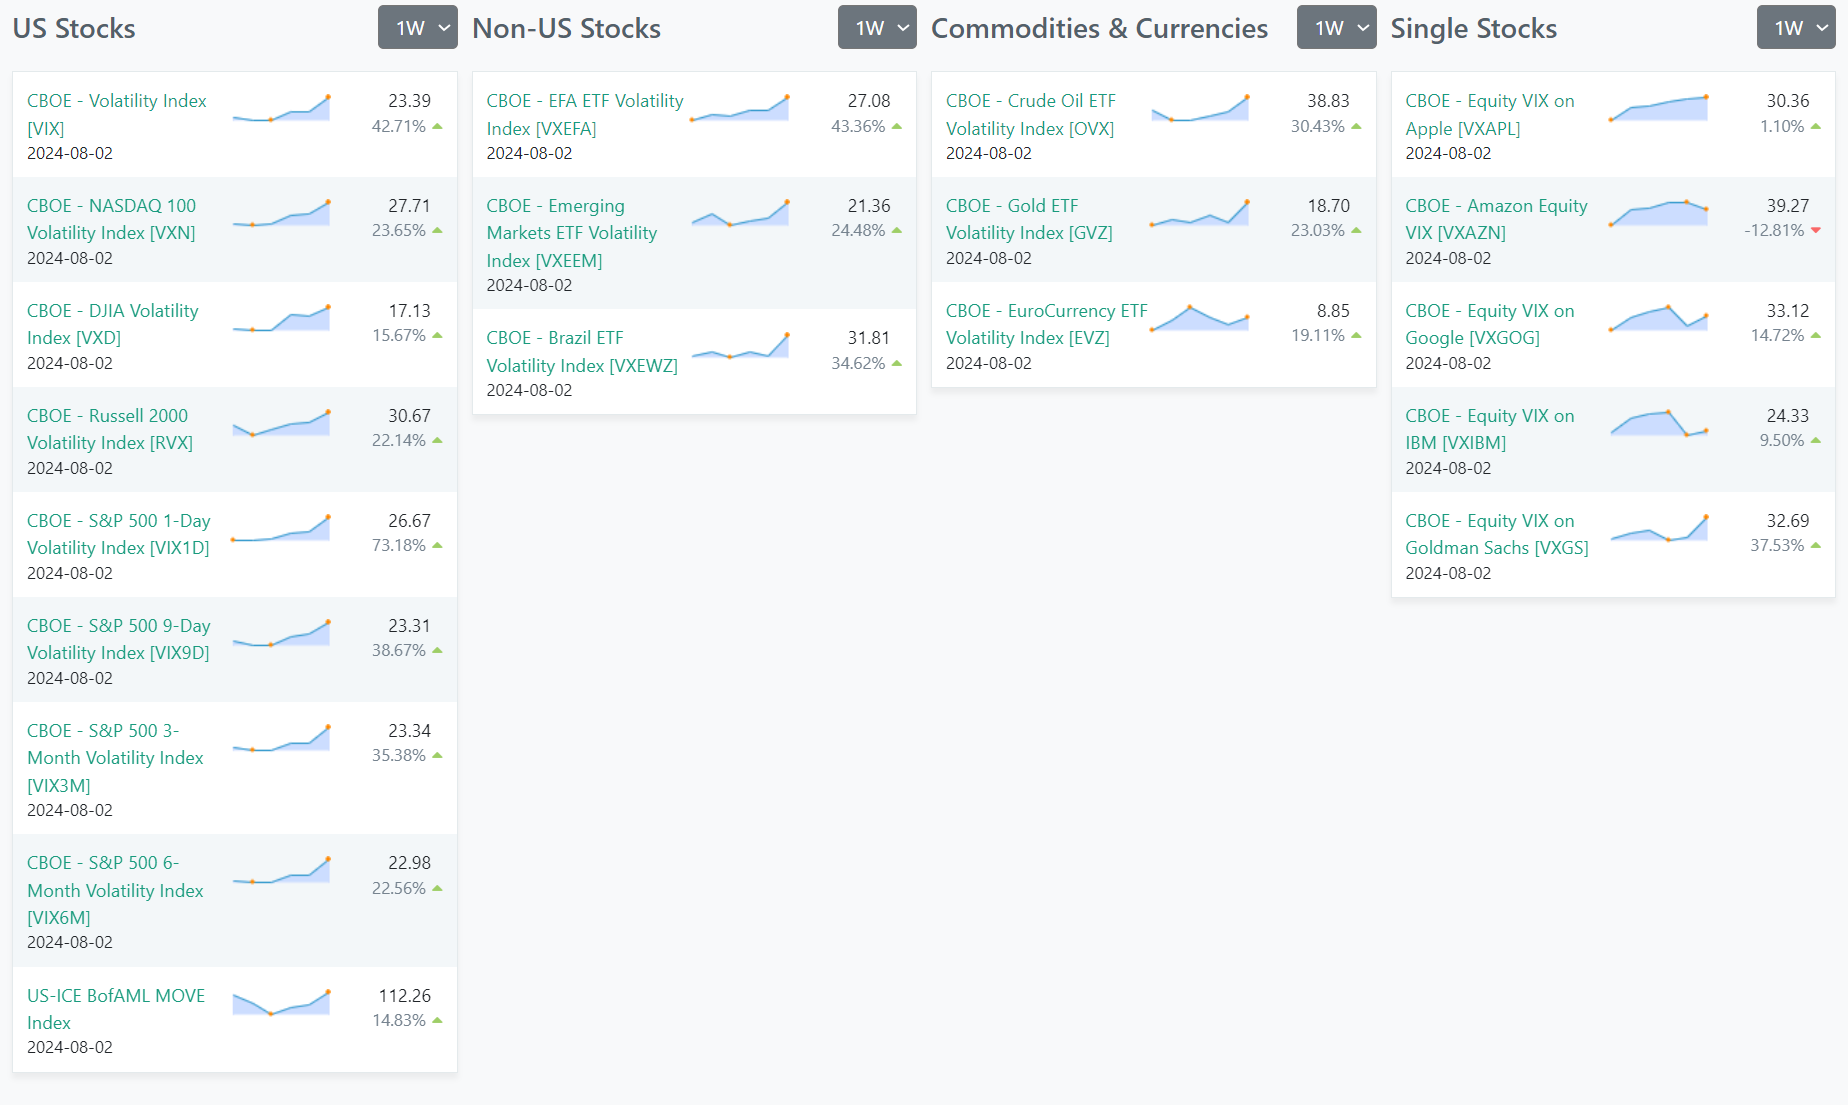
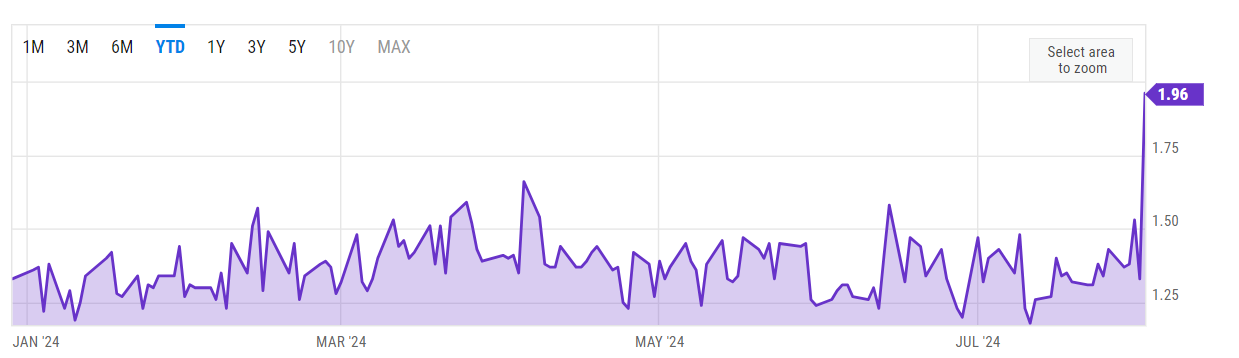
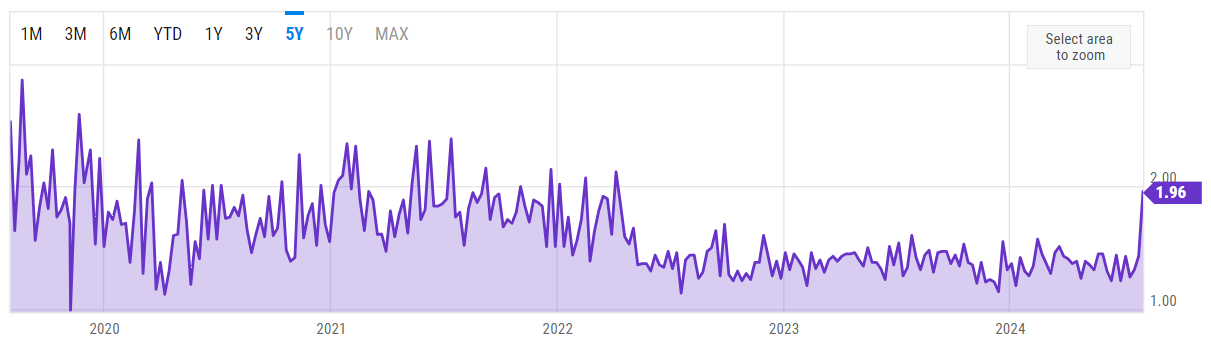
In the context of market volatility, the Cboe Volatility Index (VIX), often referred to as the "fear gauge," spiked to levels not seen since early 2023. This surge in volatility underscored the heightened uncertainty among investors, as they grappled with mixed economic data and corporate earnings. The tech-heavy Nasdaq was particularly hard hit, officially entering correction territory, having declined 10% from its recent highs.
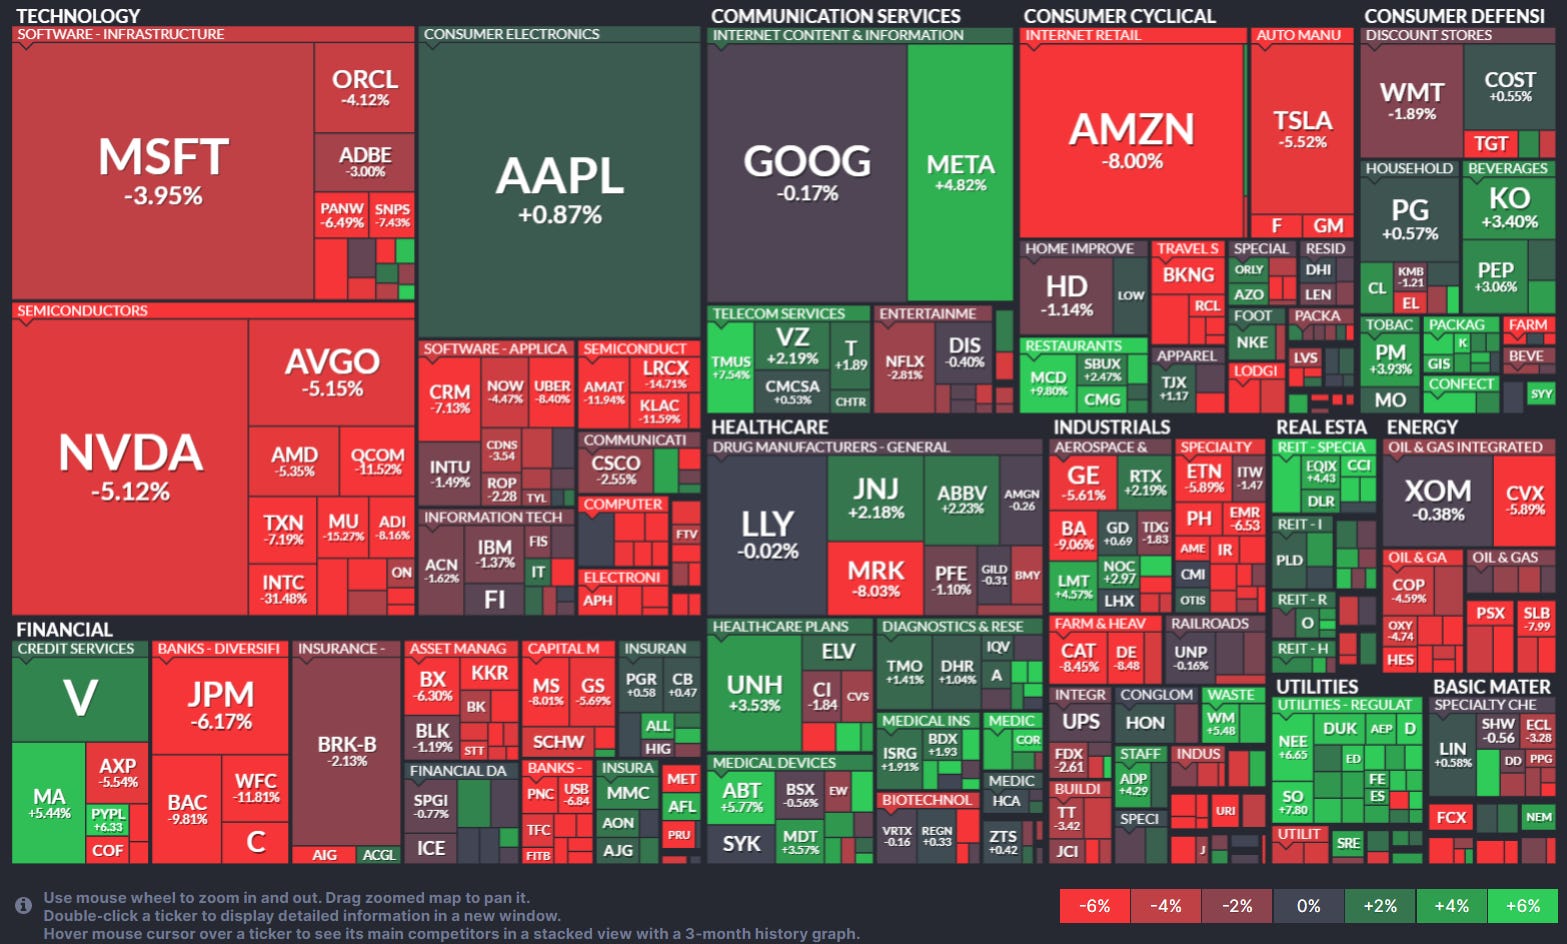
Sector-specific news was also influential. The consumer discretionary sector faced significant pressure, with stocks like Amazon AMZN and Tesla TSLA seeing declines due to concerns about slowing consumer spending. Conversely, defensive sectors such as consumer staples and utilities outperformed, as investors sought safer havens amidst the market turbulence. Companies like Procter & Gamble PG and Coca-Cola KO saw gains, reflecting a shift towards more stable, dividend-paying stocks.
The energy sector experienced mixed results, influenced by fluctuating oil prices. Crude oil prices initially rose on concerns about geopolitical instability but later fell as fears of a global economic slowdown took precedence. The PHLX Semiconductor Index (SOX), which includes major chipmakers like Nvidia NVDA and Taiwan Semiconductor TSM, also experienced a sharp decline, as the sector grappled with concerns about overvaluation and a potential slowdown in demand.
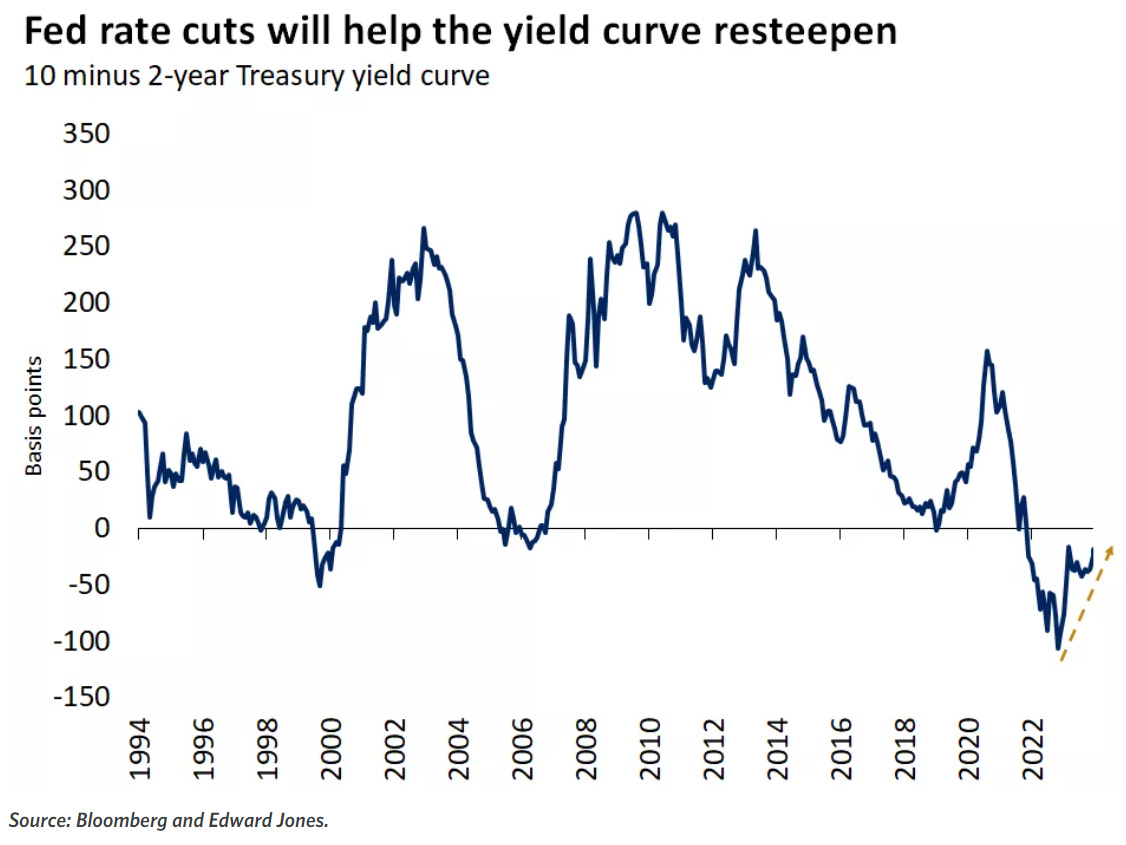
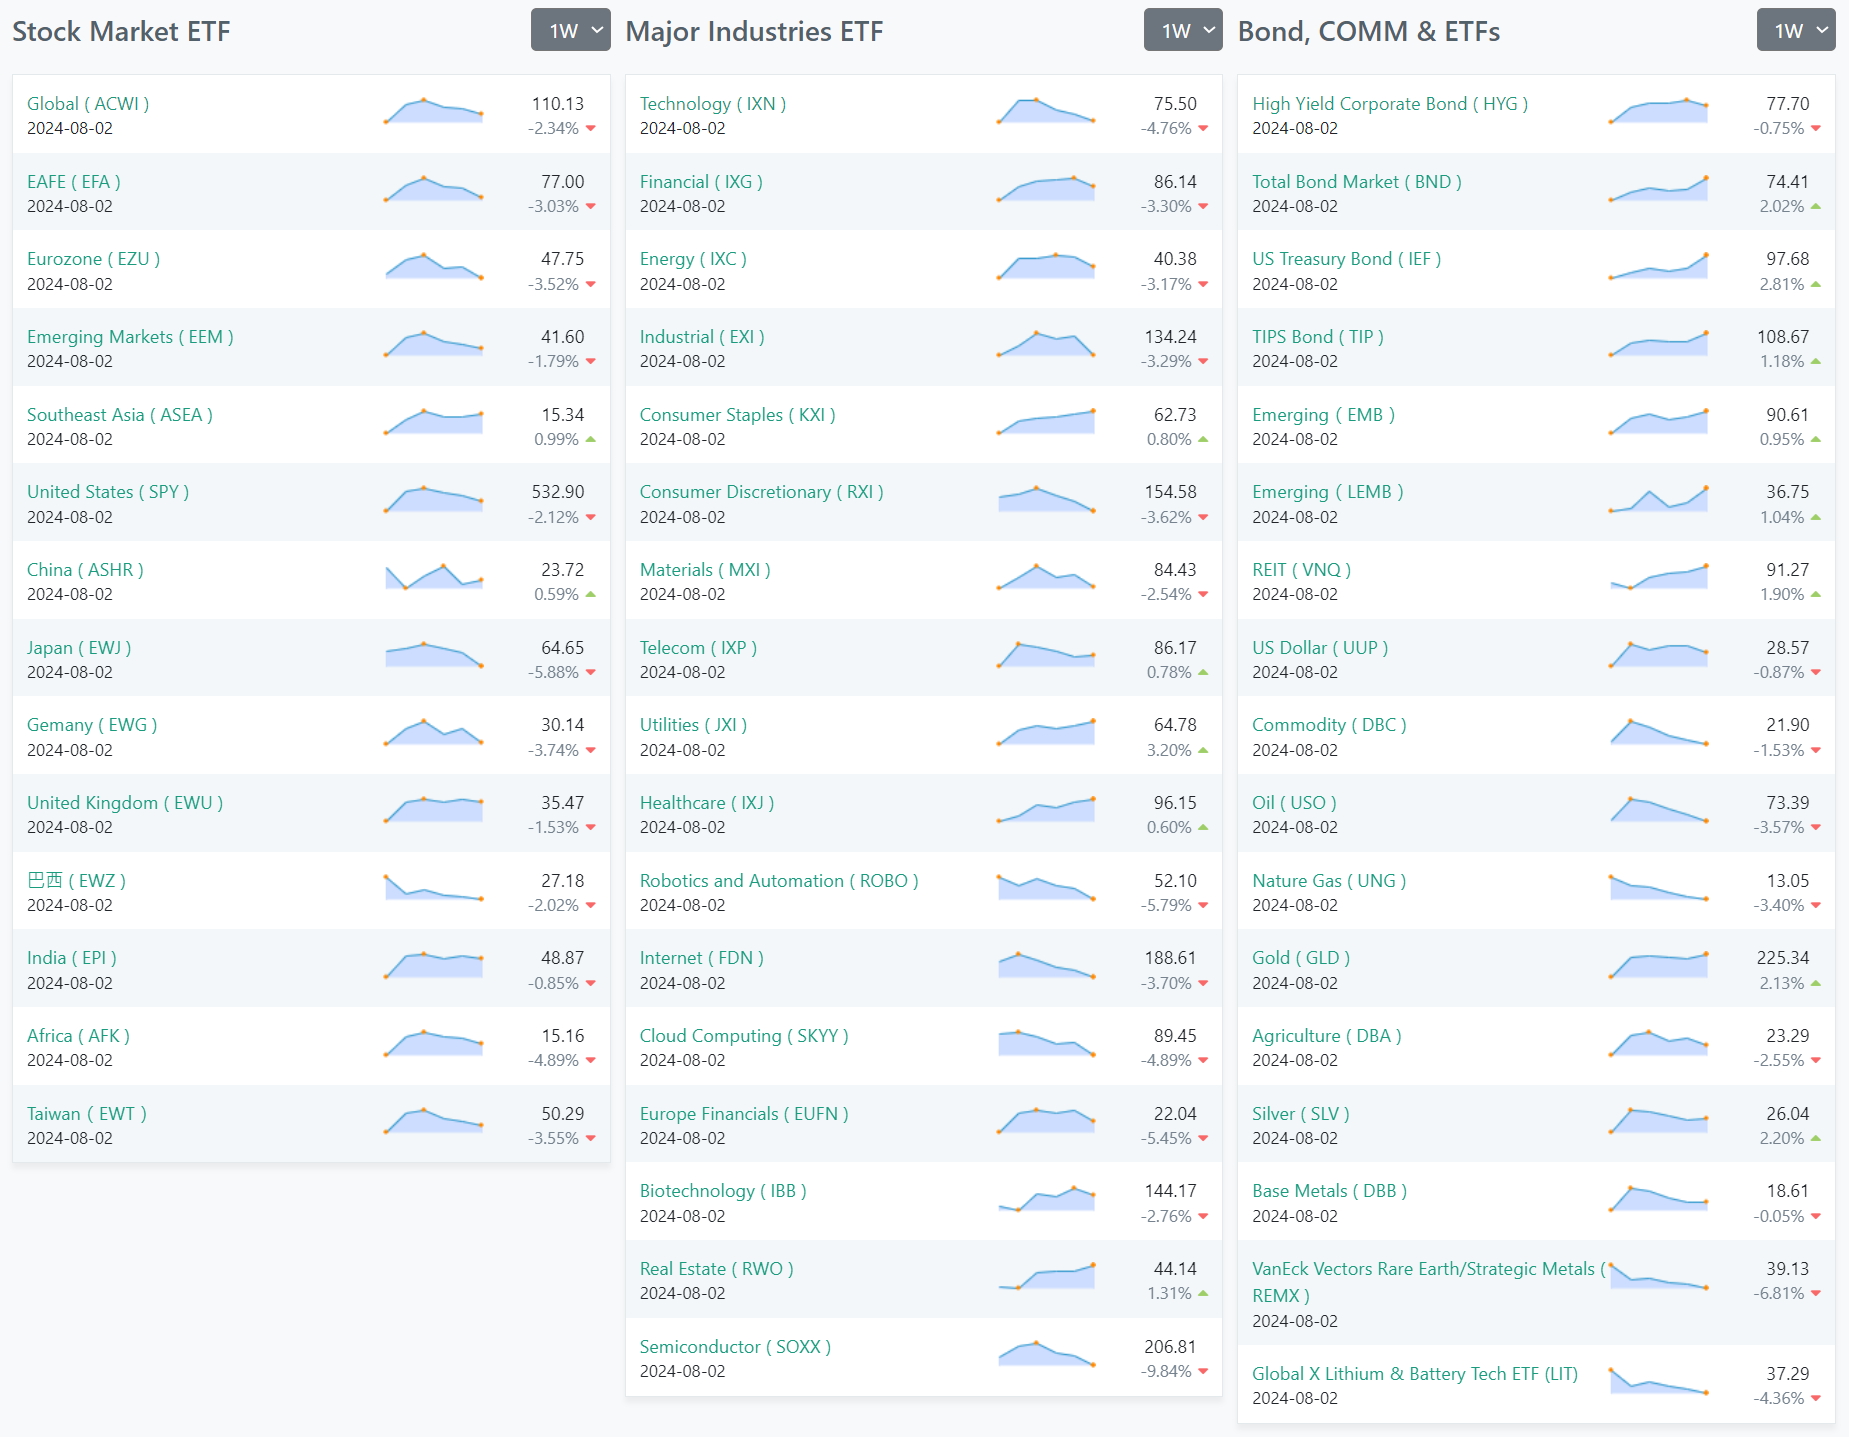
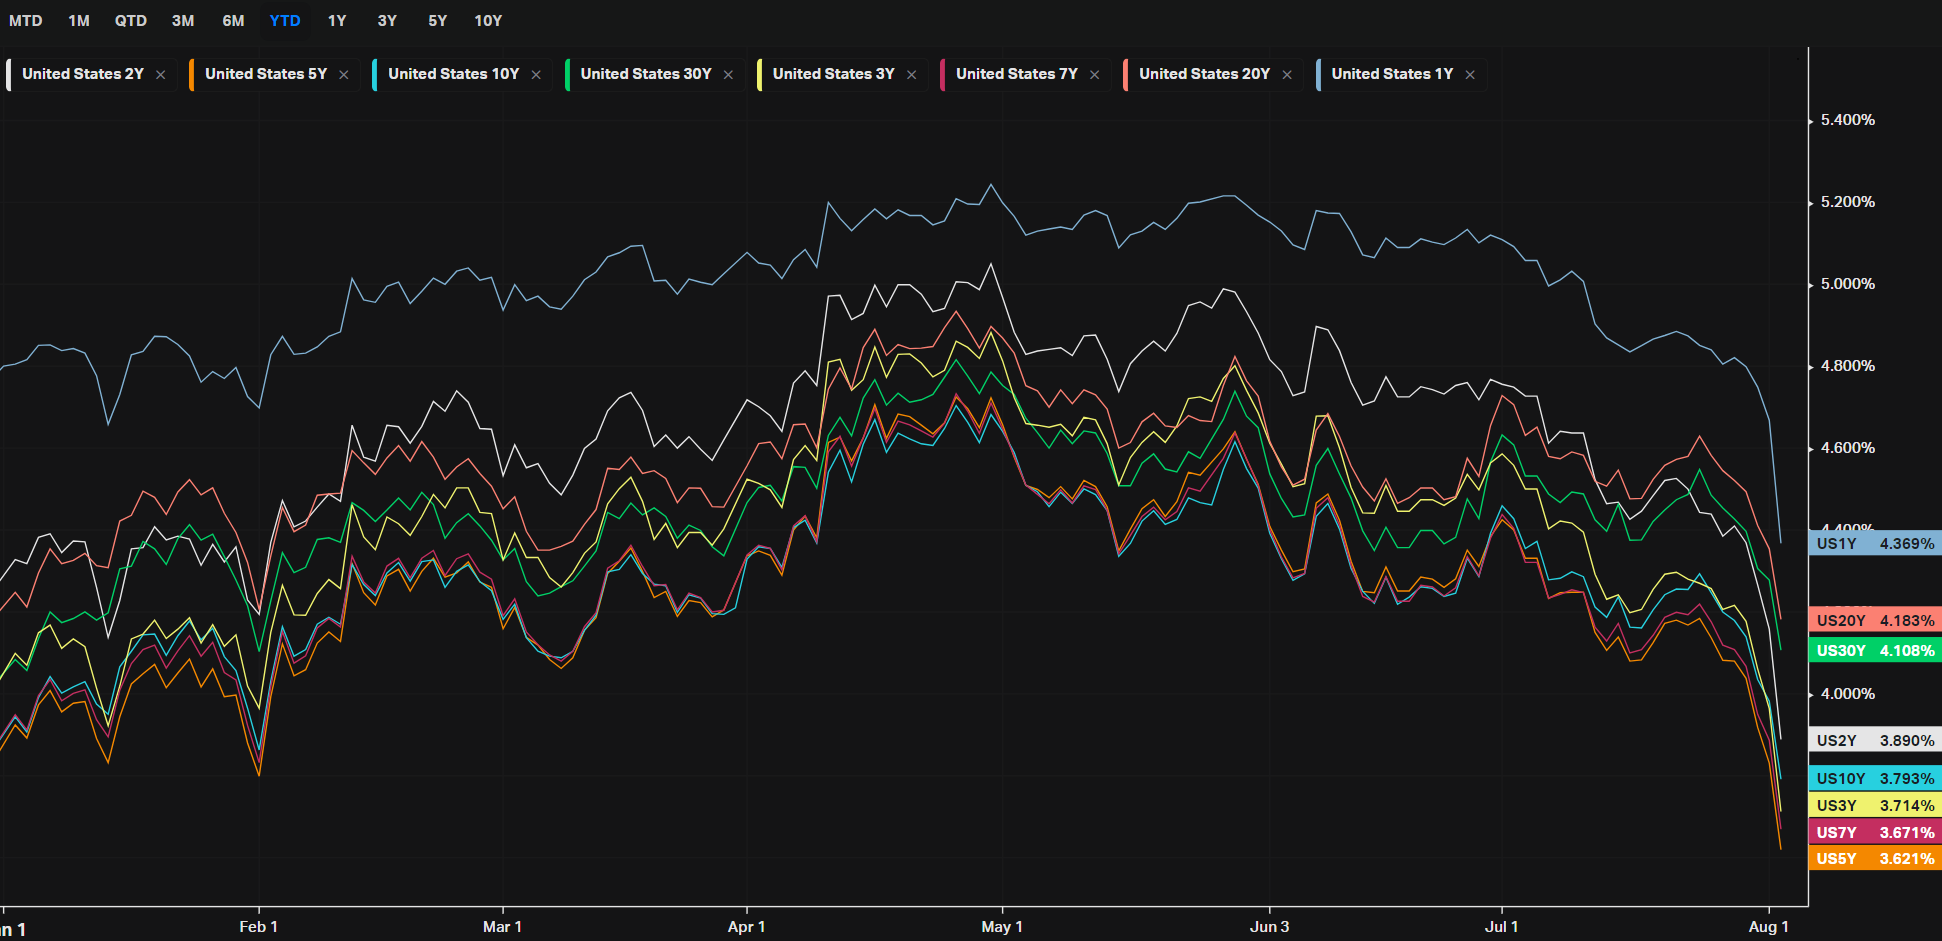
Bonds are red-hot right now. The yield curve has been inverted for over two years, with short-term bond yields higher than long-term ones, signaling restrictive Fed policy and economic caution. Recently, there's been a shift, as the Fed hints at easing rates. This has led to a rally in bond prices and a drop in yields, particularly in 2-year and 10-year notes. As the Fed moves towards rate cuts, short-term yields are expected to decline faster, normalizing the yield curve. Many investors weighing the risks of holding too much cash in a falling rate environment.
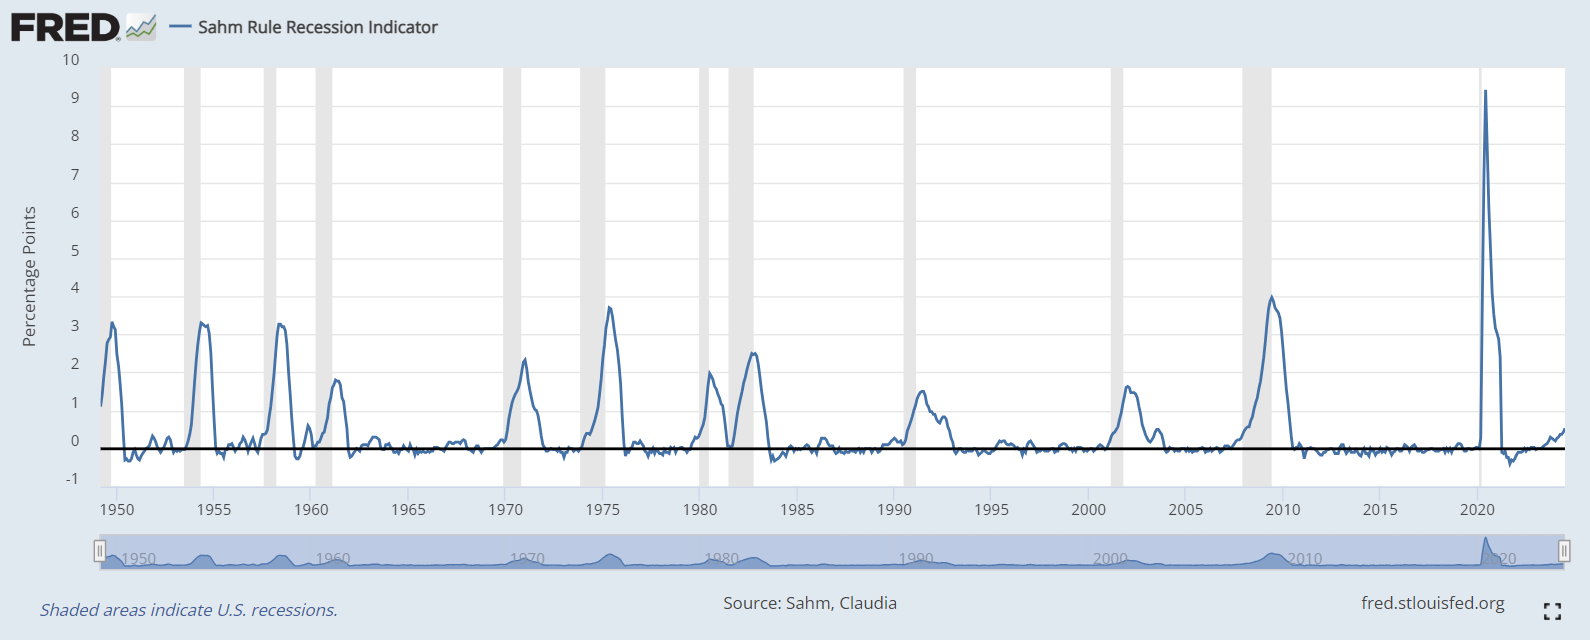
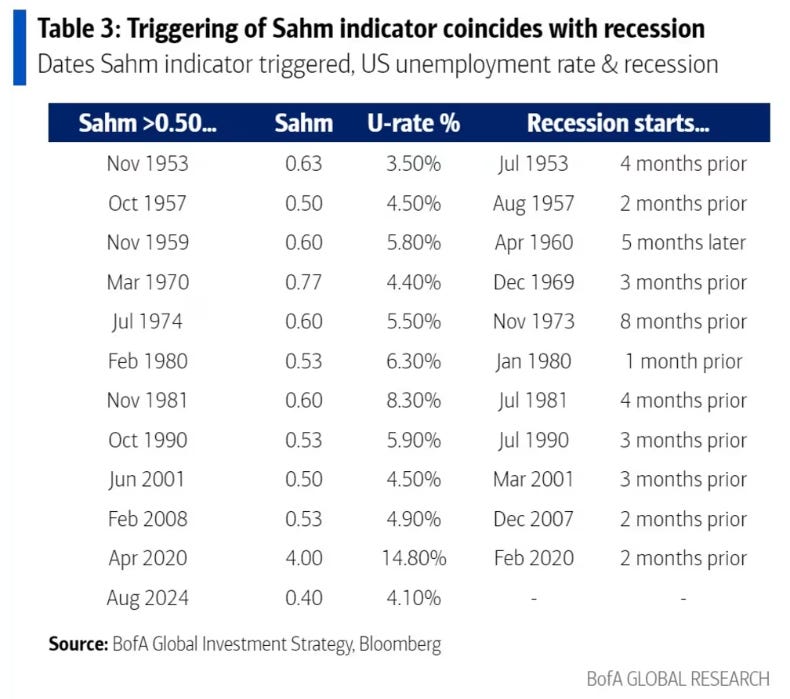
Adding to the market's complexity, the Sahm Rule, a recession indicator, was triggered. The Sahm Rule suggests that a recession is likely when the three-month average unemployment rate rises by 0.5 percentage points or more relative to its low over the previous 12 months. With the unemployment rate increasing to 4.3%, this indicator raised further concerns about the possibility of an economic downturn, reinforcing the cautious stance among investors.
In conclusion, the week of July 29 through August 2, 2024, was characterized by significant market volatility, driven by a combination of disappointing corporate earnings, geopolitical tensions, and mixed economic data. The potential for a rate cut by the Federal Reserve emerged as a key focus for investors, as they assessed the implications of a slowing economy and rising unemployment. Defensive sectors gained favor, while tech and consumer discretionary stocks faced pressure. The activation of the Sahm Rule added another layer of concern, highlighting the delicate balance between growth and inflation in the current economic landscape. As the market looked ahead, the potential for further monetary easing and the trajectory of economic data remained central to investor sentiment.
This Week’s Snapshots
Volatility
ETFs
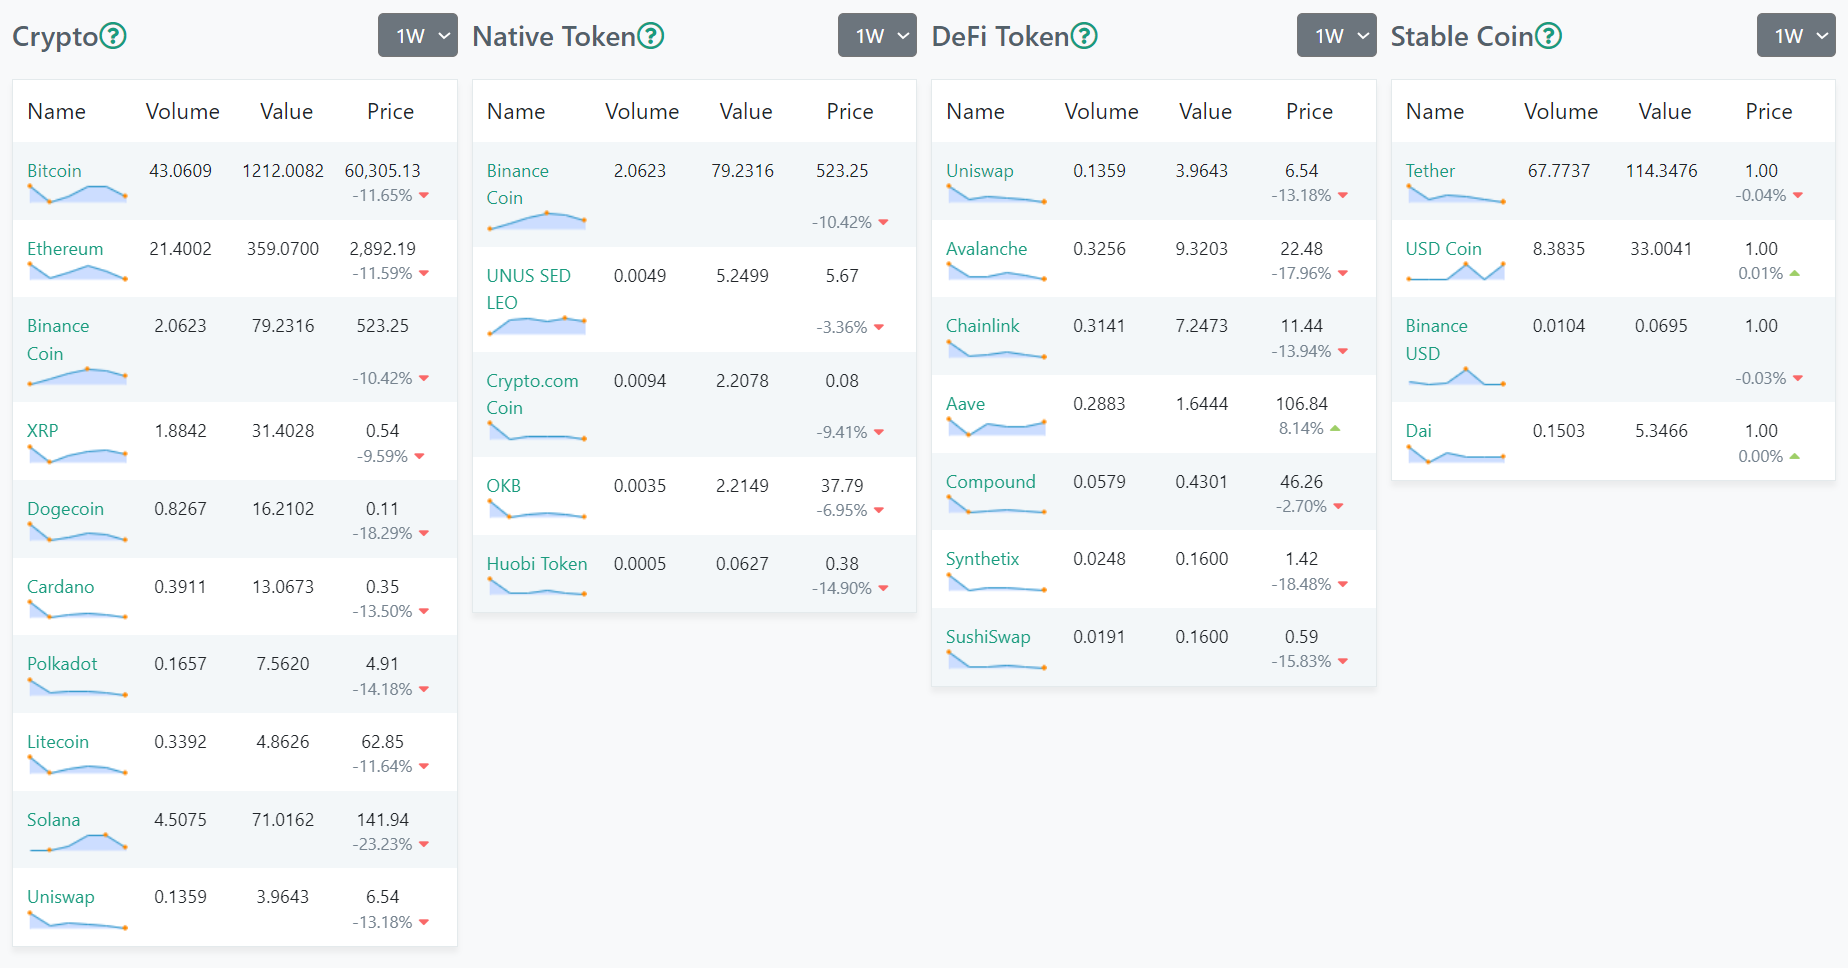
Crypto
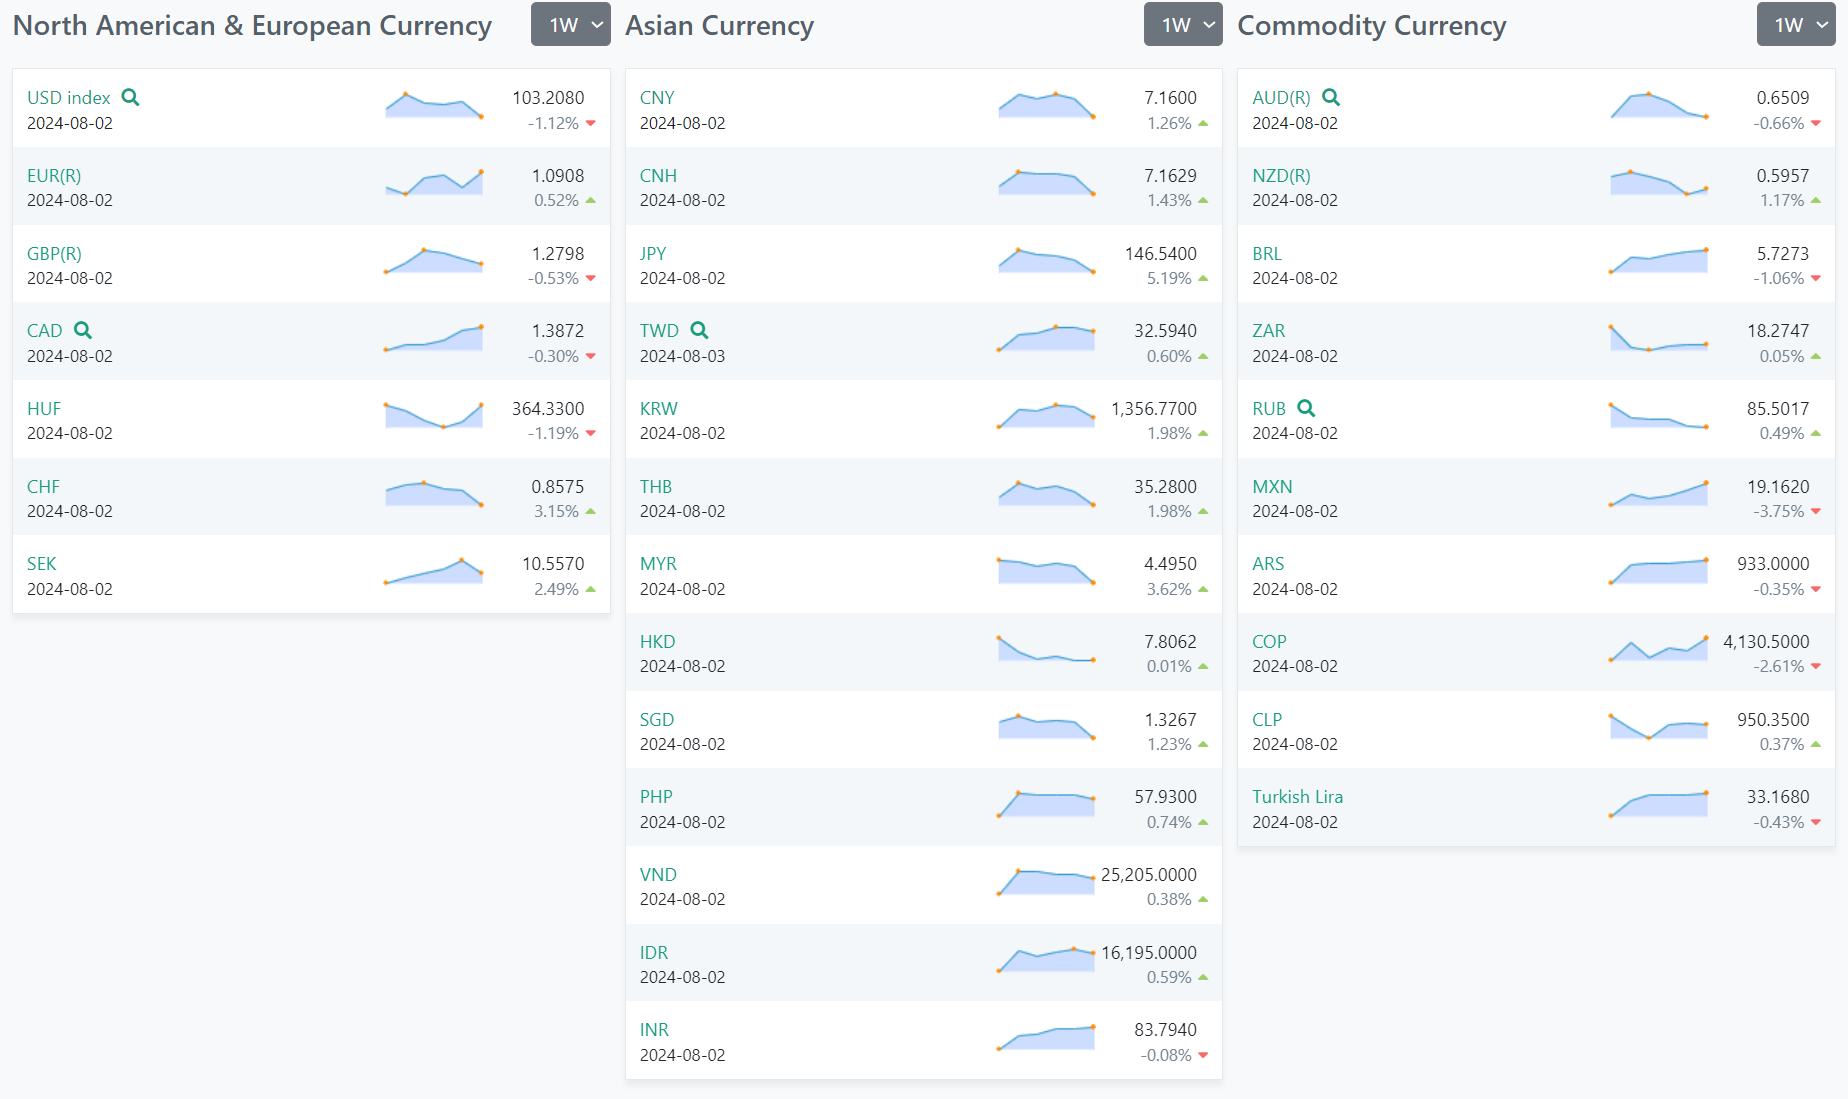
Forex
US Investor Sentiment
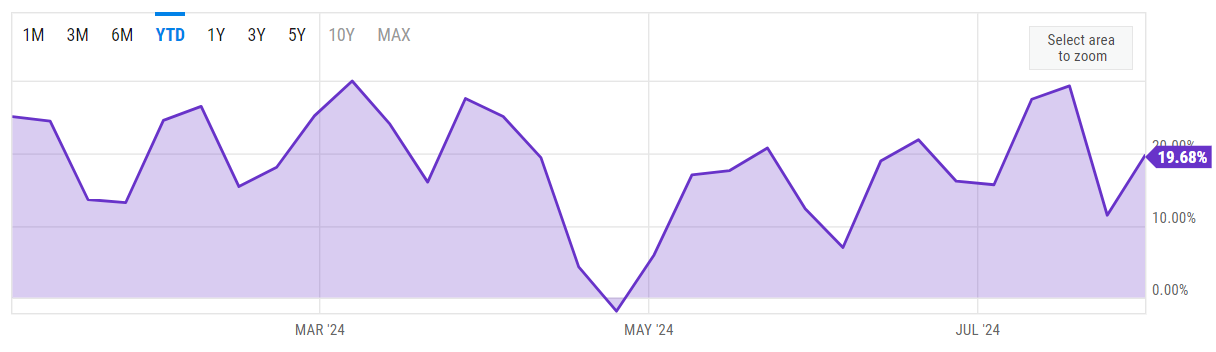
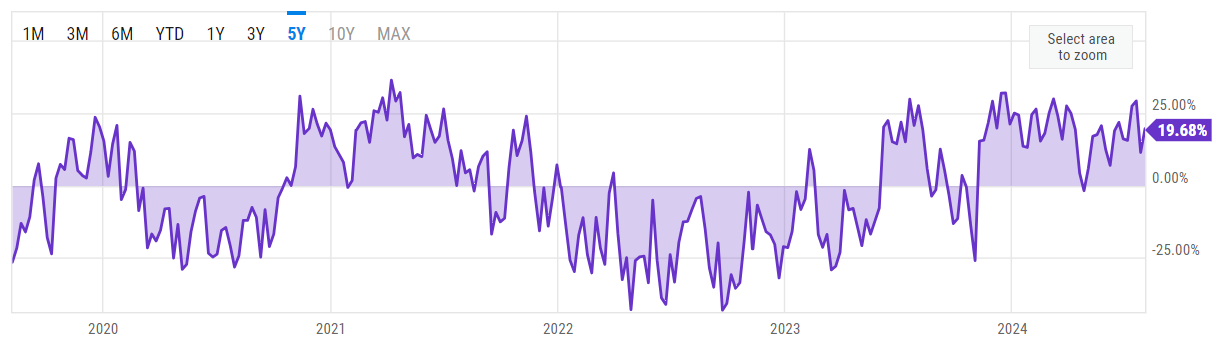
%Bull-Bear Spread
Coming in at 19.69%, compared to 11.44% last week and 20.79% last year. This is higher than the long term average of 6.66%.
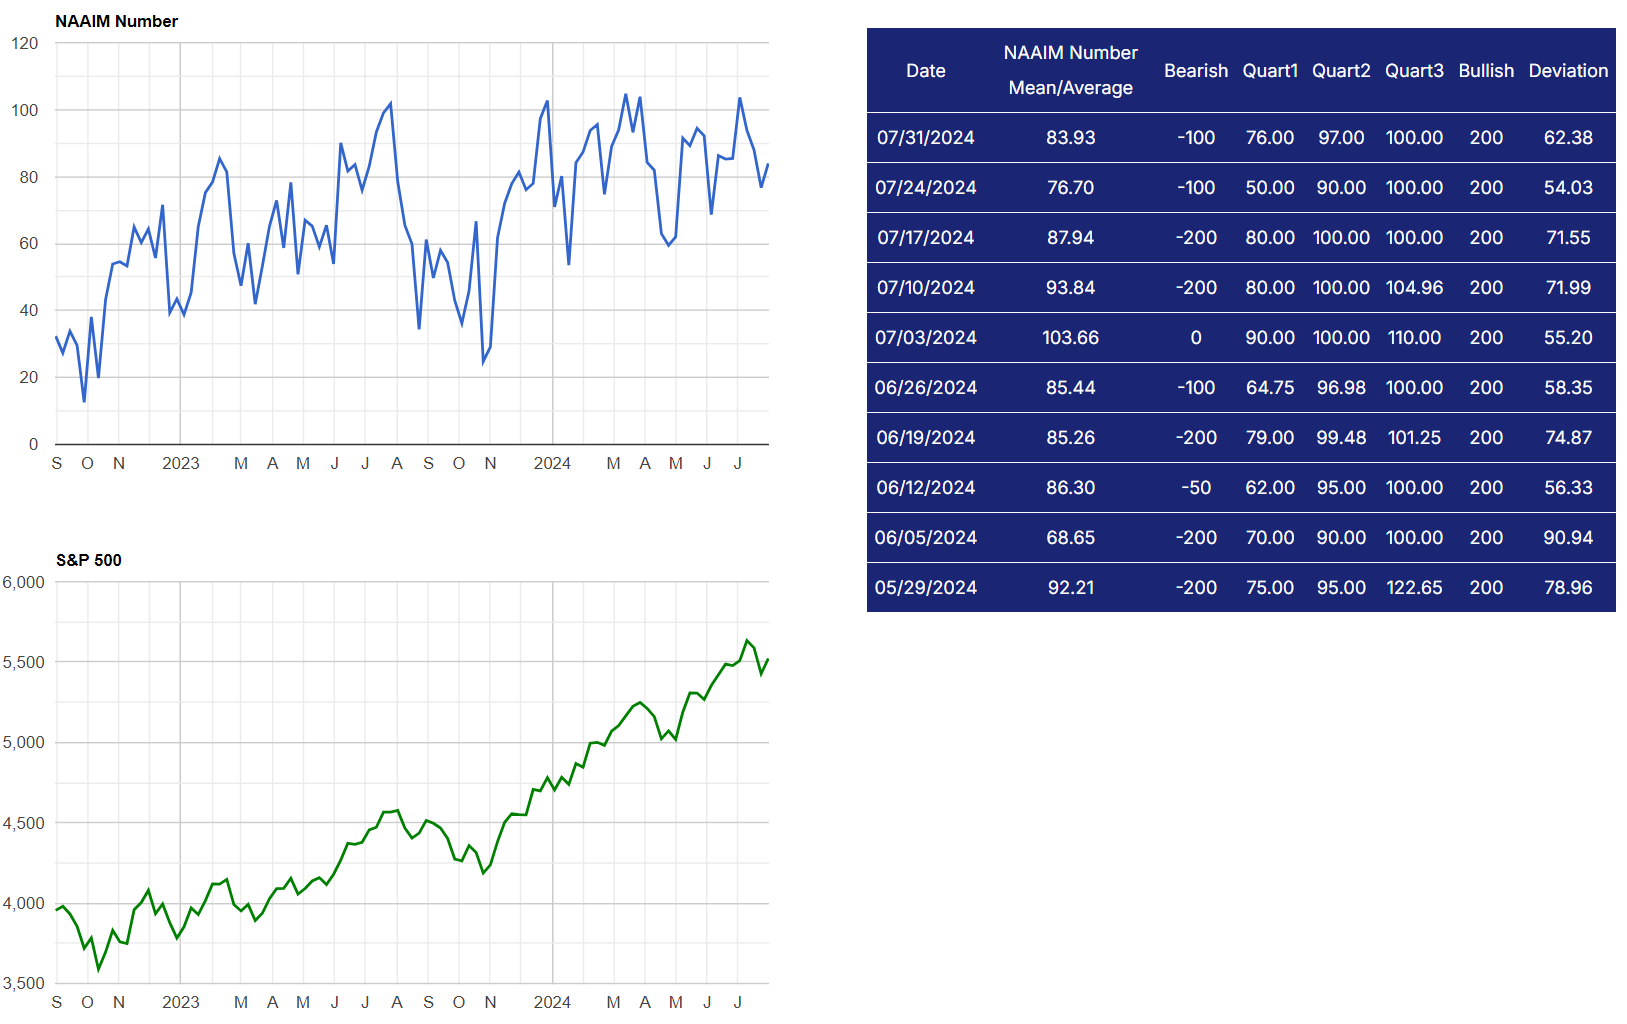
NAAIM Exposure Index
The NAAIM Exposure Index, which measures the average exposure of active investment managers to U.S. equity markets, showed significant variations in recent weeks. As of July 31 the index stood at 83.93, up from 76.60 the previous week but still muted from recent highs of 103.66. The increase reflects a bullish sentiment among active managers, indicating a shift towards greater equity exposure despite recent market volatility; it seems that active managers are increasingly optimistic about the market's near-term prospects, possibly influenced by expectations of potential easing in monetary policy and a more favorable economic outlook.
SPX Put/Call Ratio
CBOE Equity Put/Call Ratio
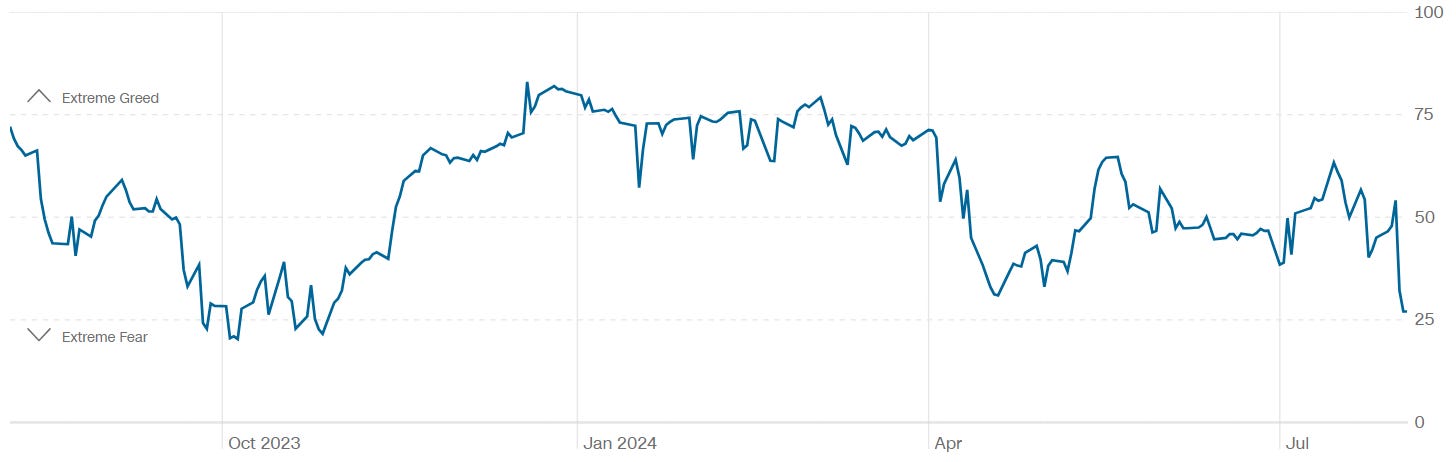
CNN Fear & Greed Index
Institutional S/R Levels For Major Indices
When you’re a large institutional player, your primary goal is to find liquidity - places to do a ton of business with the least amount of slippage possible. VolumeLeaders.com automatically identifies and visually plots the exact spots where institutions are doing business and where they are are likely to return for more. It’s one of the primary reasons “support” and “resistance” concepts work and truly one of the reasons “price has memory”.
Levels from the VolumeLeaders.com platform can help you formulate trades theses about:
- Where to add or take profit
- Where to de-risk or hedge
- What strikes to target for options
- Where to expect support or resistance
This is just a small sample; there are countless ways to leverage this information into trades that express your views on the market. The platform covers thousands of tickers on multiple timeframes to accommodate all types of traders. Observe for yourself how accurate the levels are by marking-up your charts with the information in the “Trade Levels” boxes I’m giving for free below and play-along in real-time this week. These charts cover the past 7 or so sessions but subs will get new levels as they develop in real-time and have access to levels from other time frames. I’m confident you’ll see how clear-cut, intuitive and actionable this information is for yourself.
SPDR S&P 500 SPY
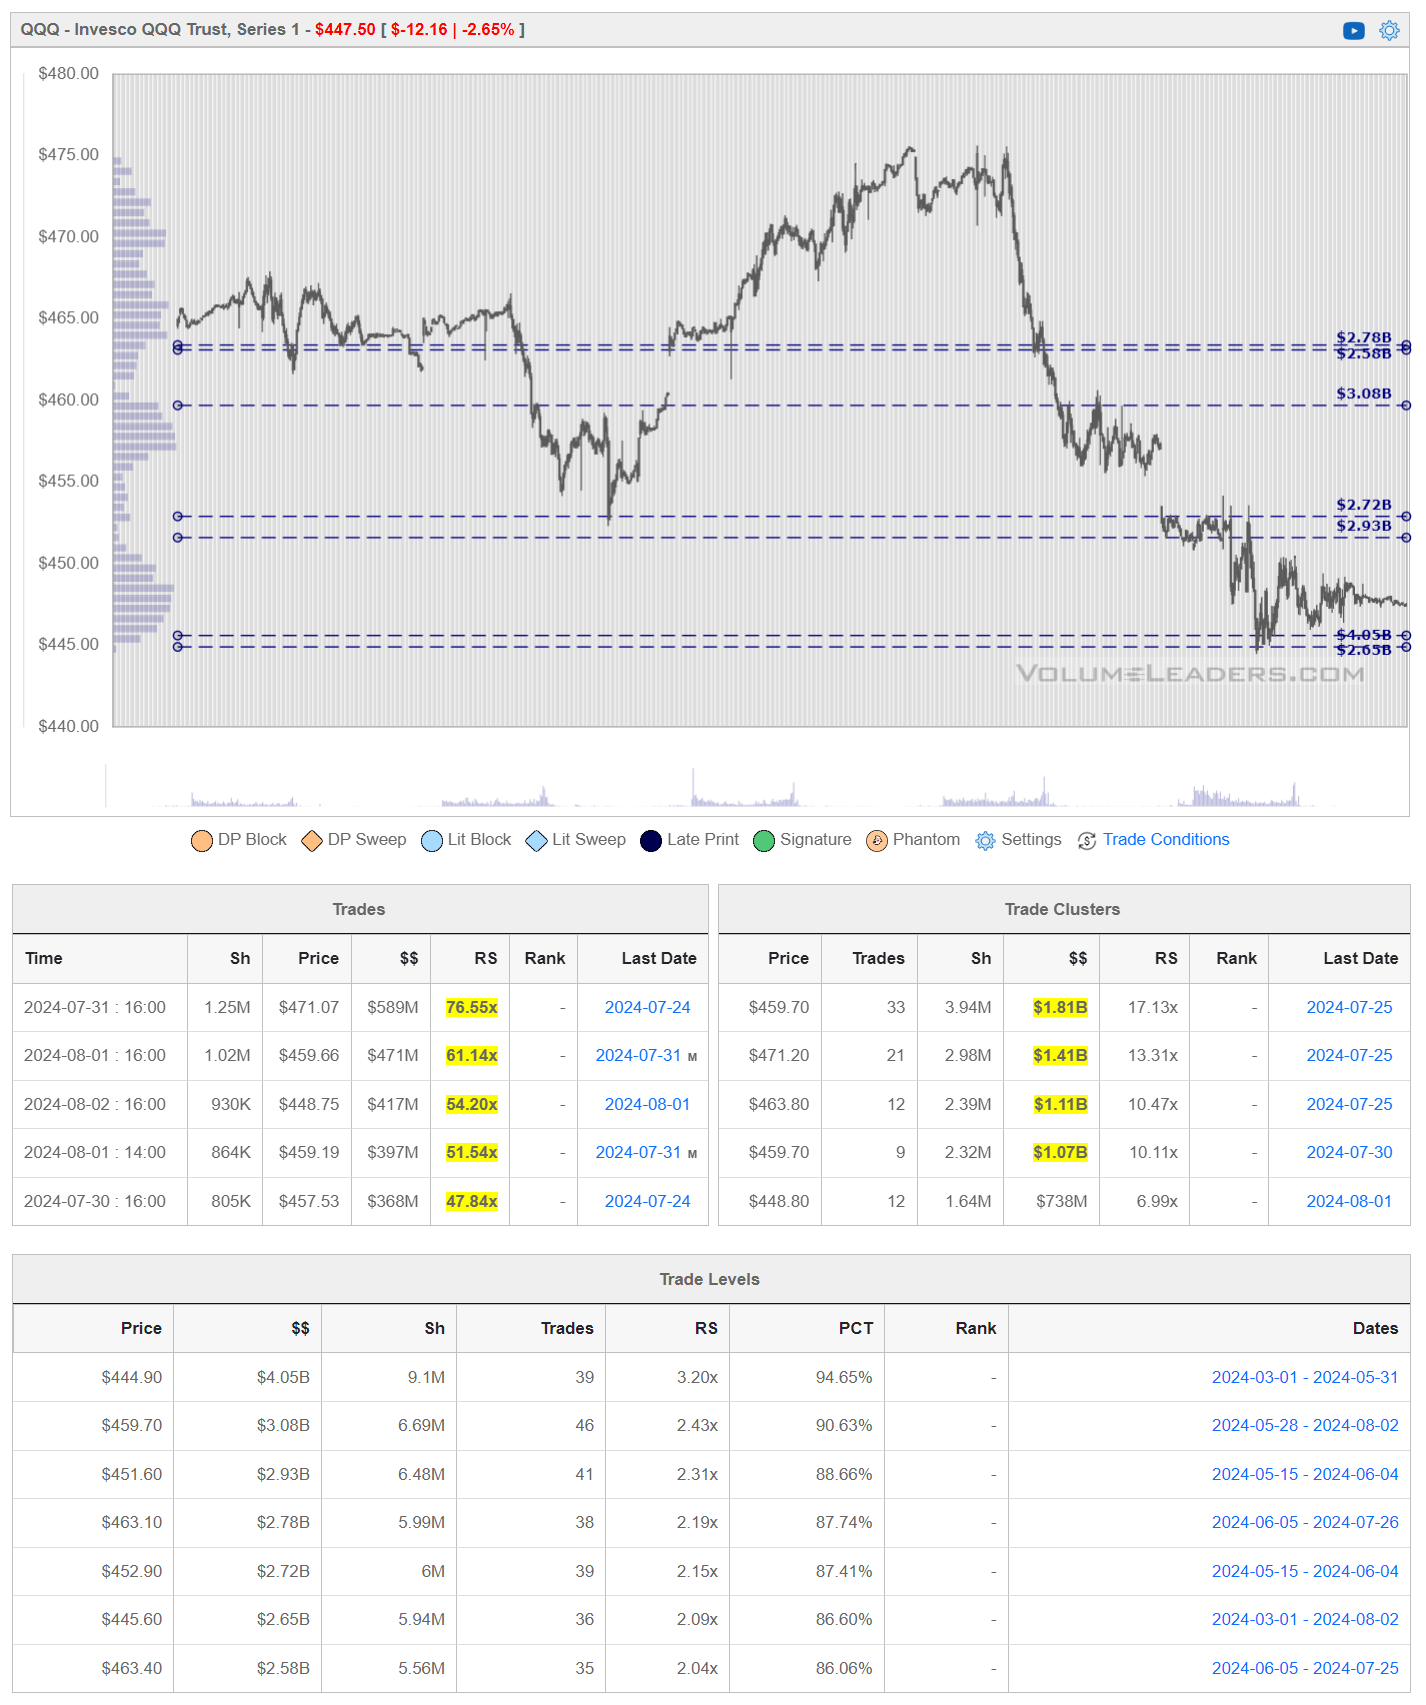
Invesco QQQ Trust, Series 1 QQQ
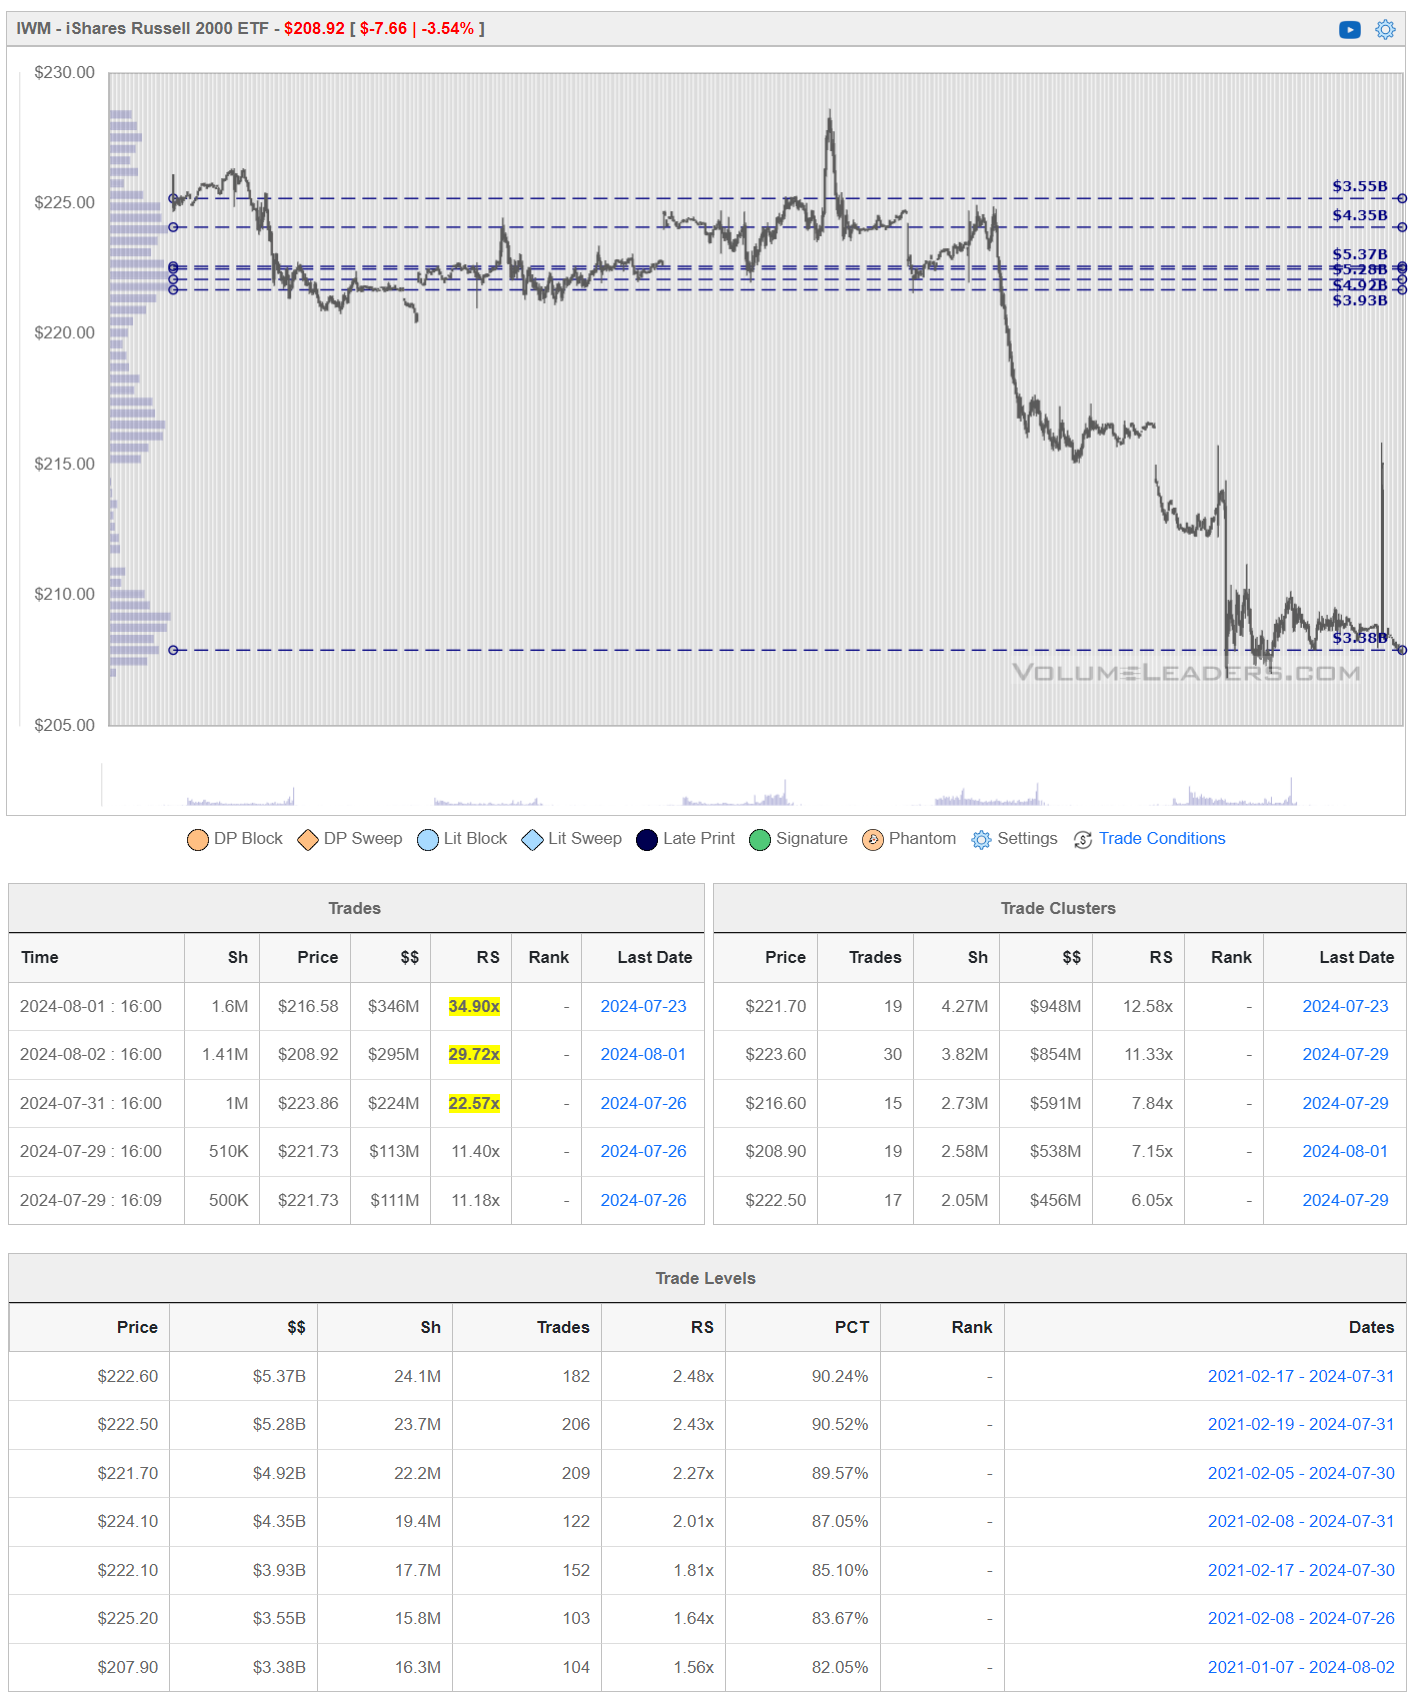
IShares Russell 2000 ETF IWM
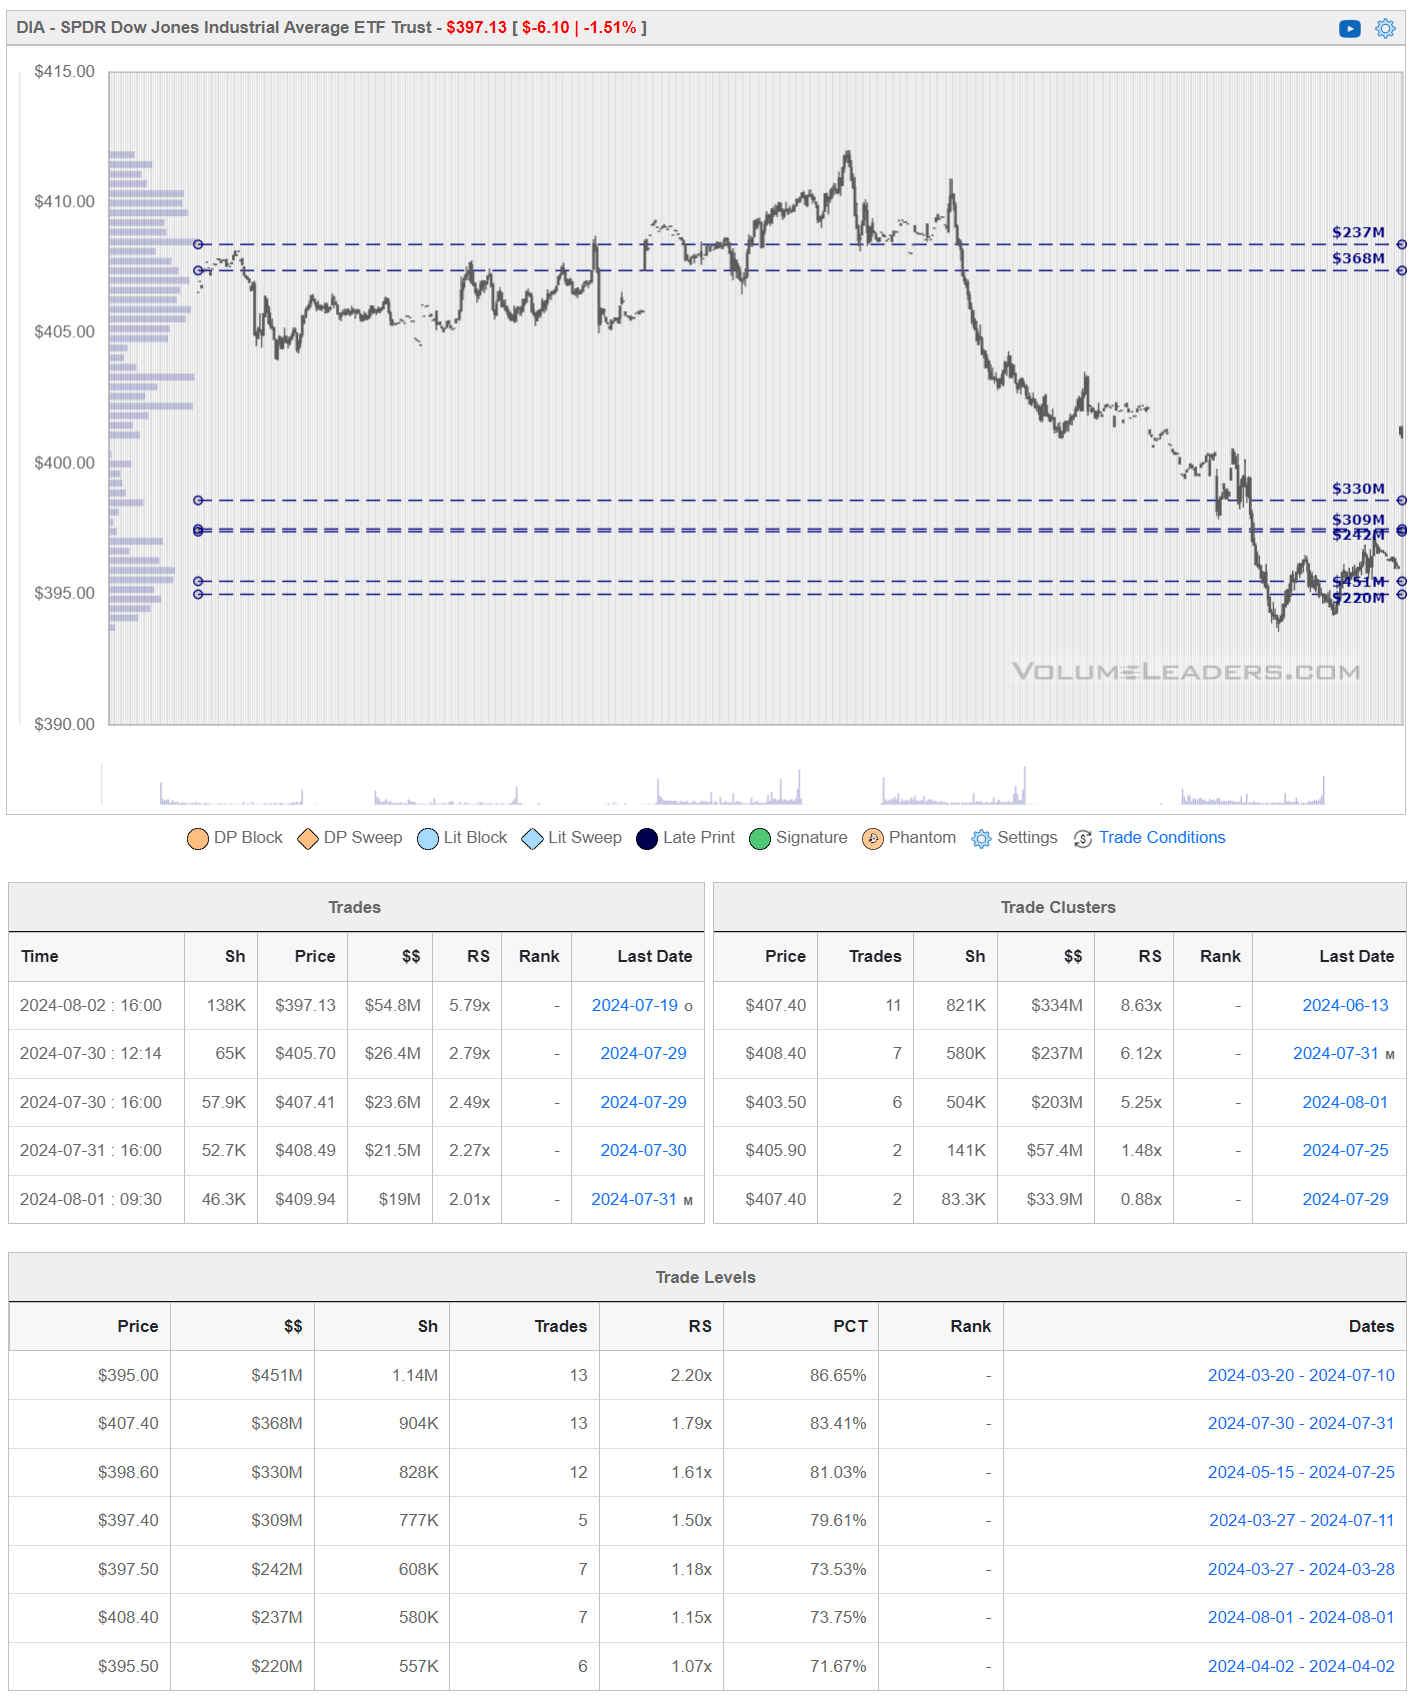
SPDR Dow Jones Industrial Average ETF DIA
Get these levels in your inbox every week before the market opens, subscribe now
Top Institutional Order Flow
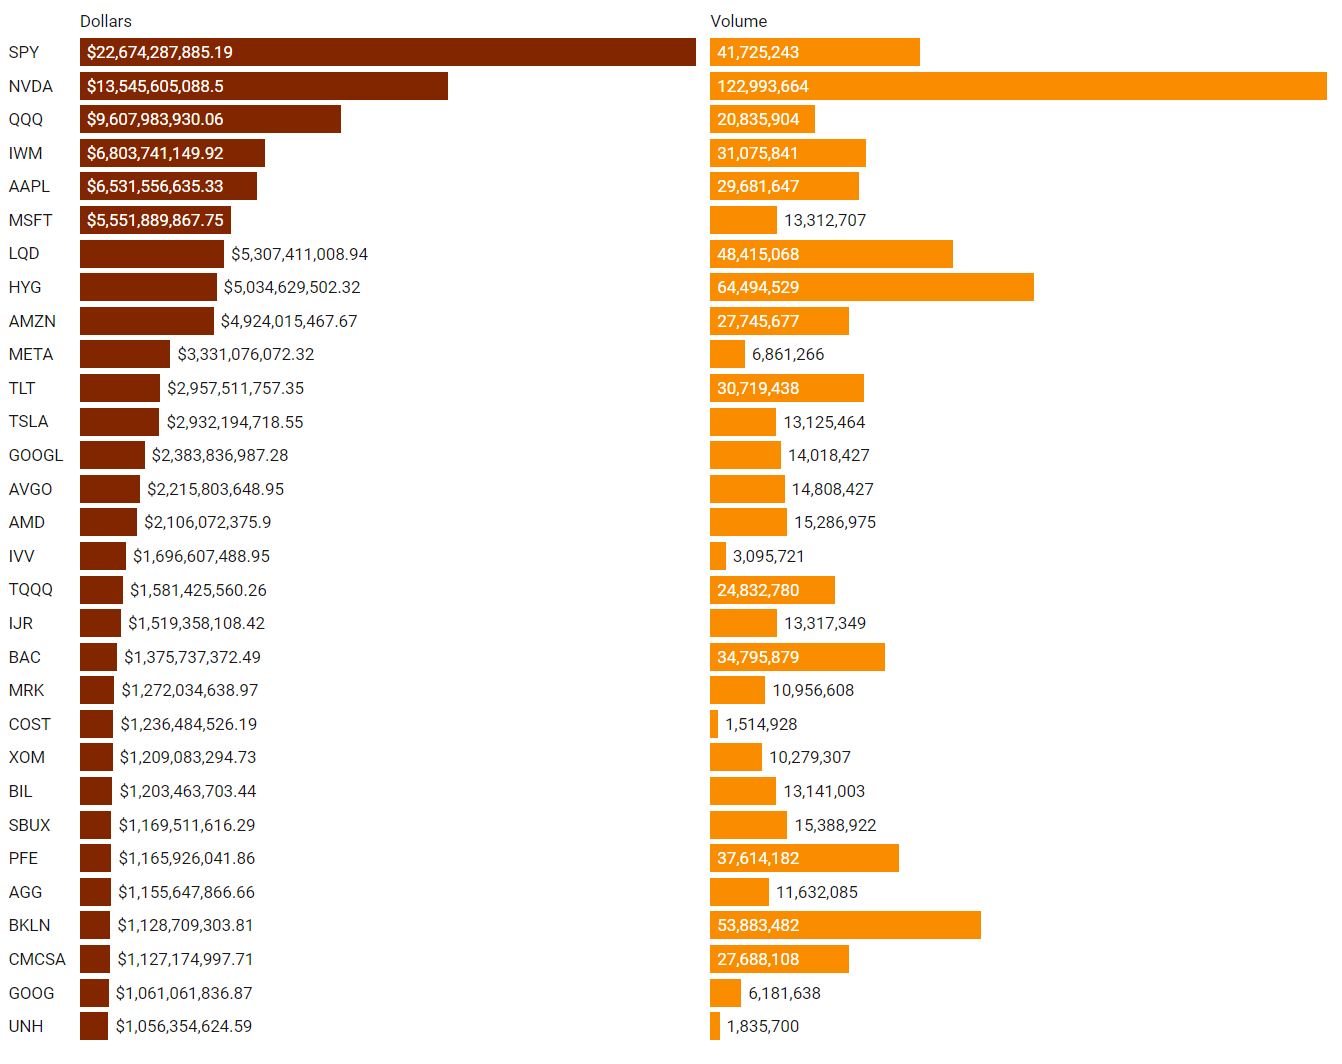
There are often great trades ideas or sources for inspiration in these prints. Only the top 30 of each group are shown but the full results are available in VL for you to browse at your leisure. Don’t forget to setup trade alerts inside the platform so you never miss institutional order flow that piques your interest or is otherwise important to you. Blue charts include all trade types including blocks on lit exchanges; red/orange charts are dark pool only trades; green charts are sweeps only.
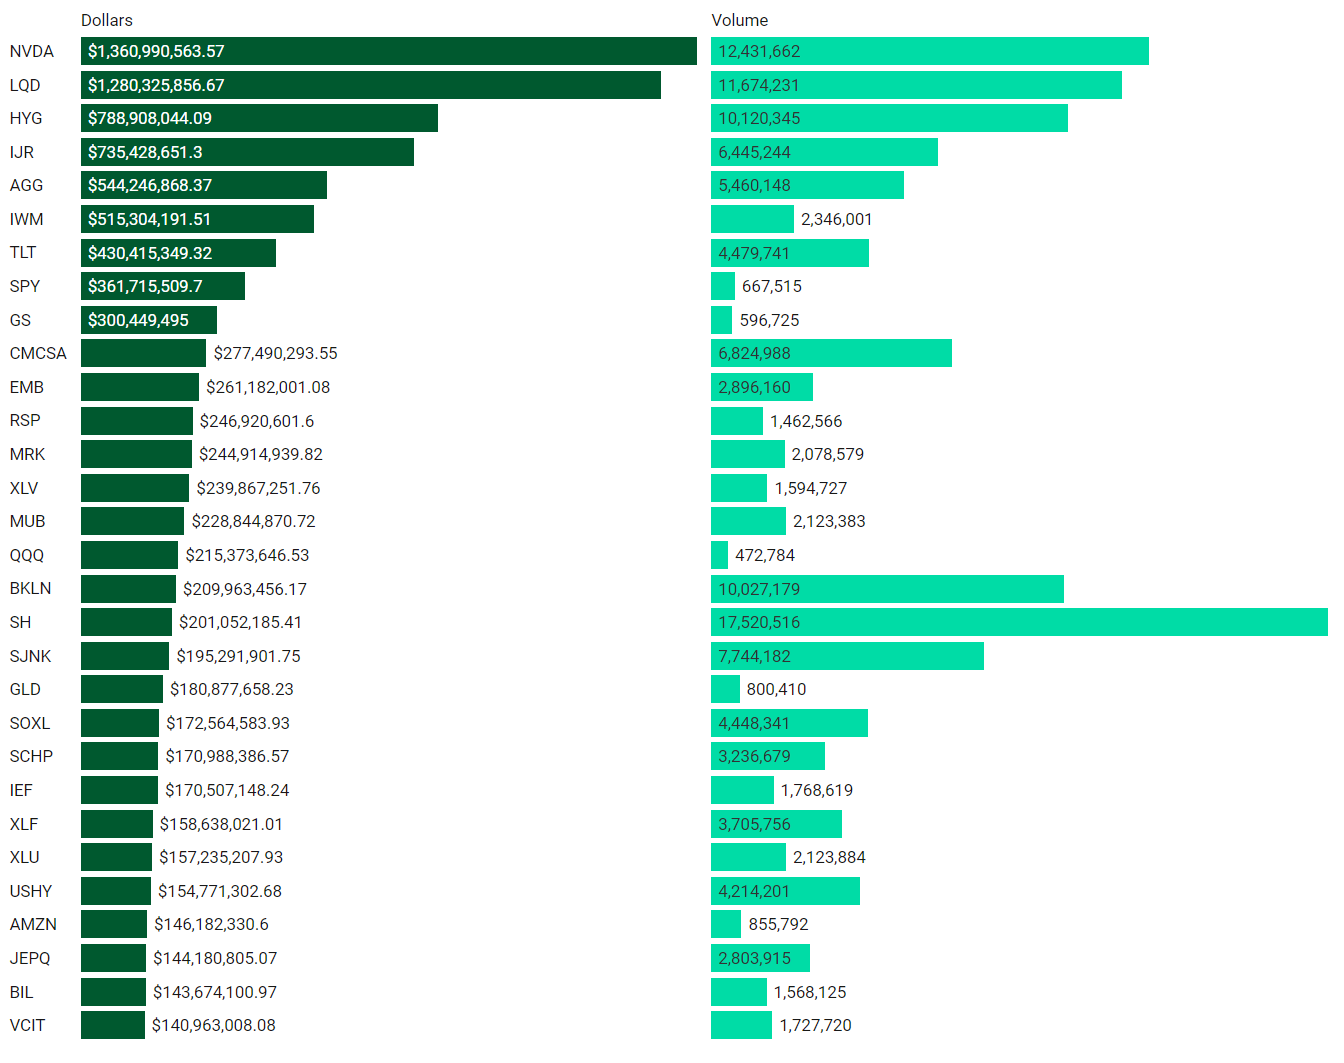
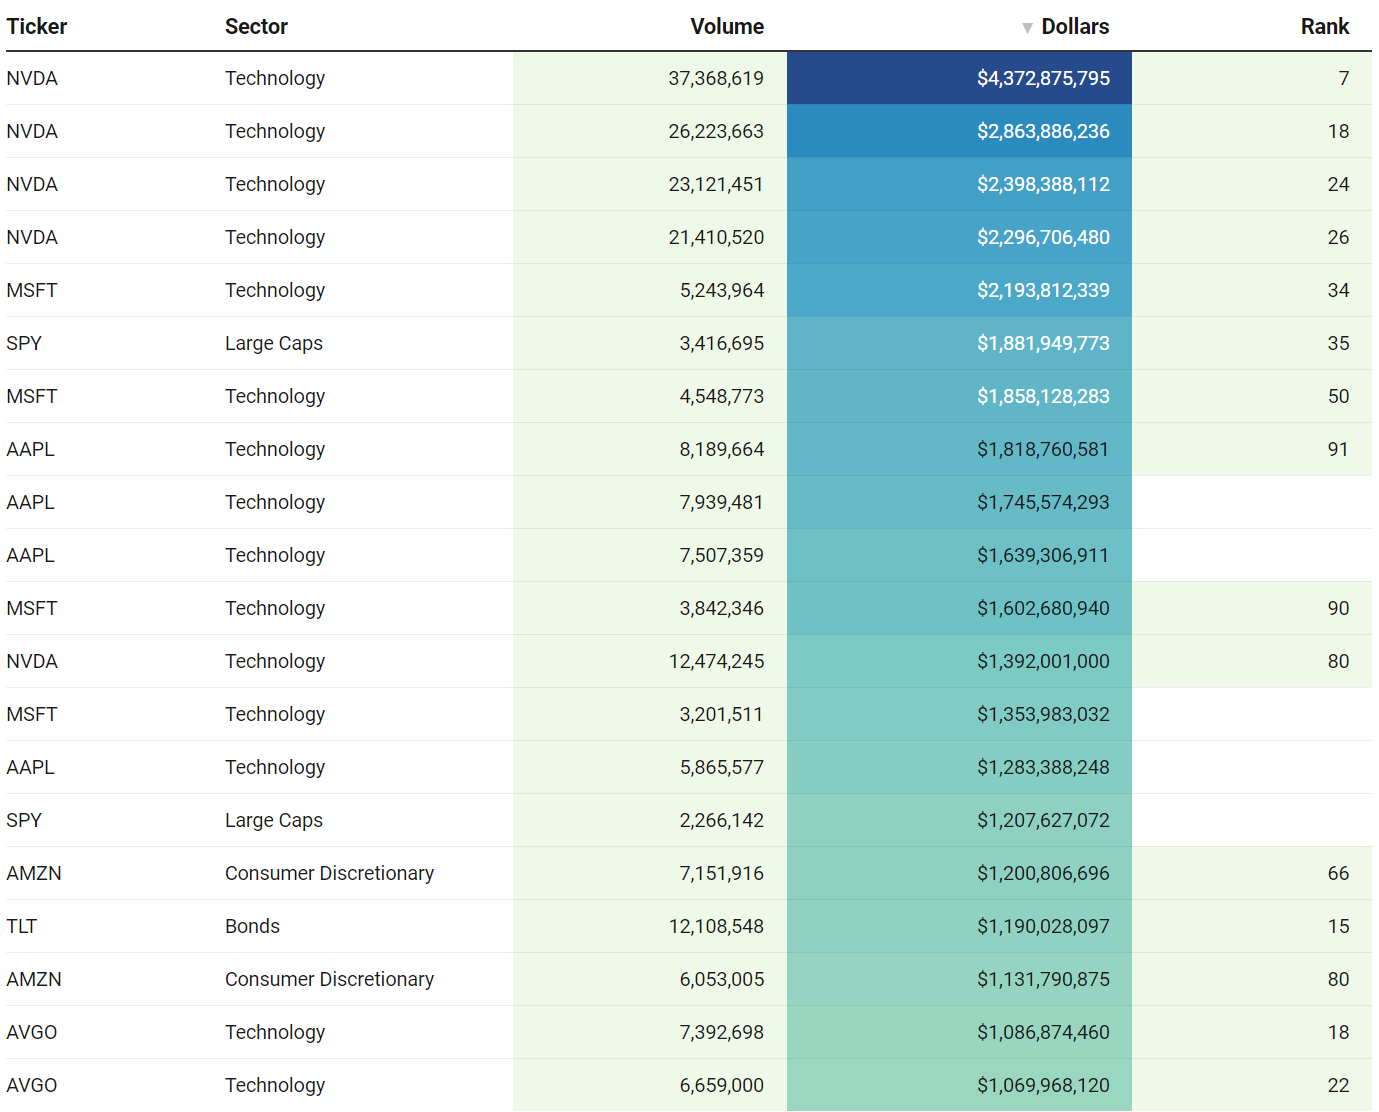
Top Aggregate Dollars Transacted By Ticker
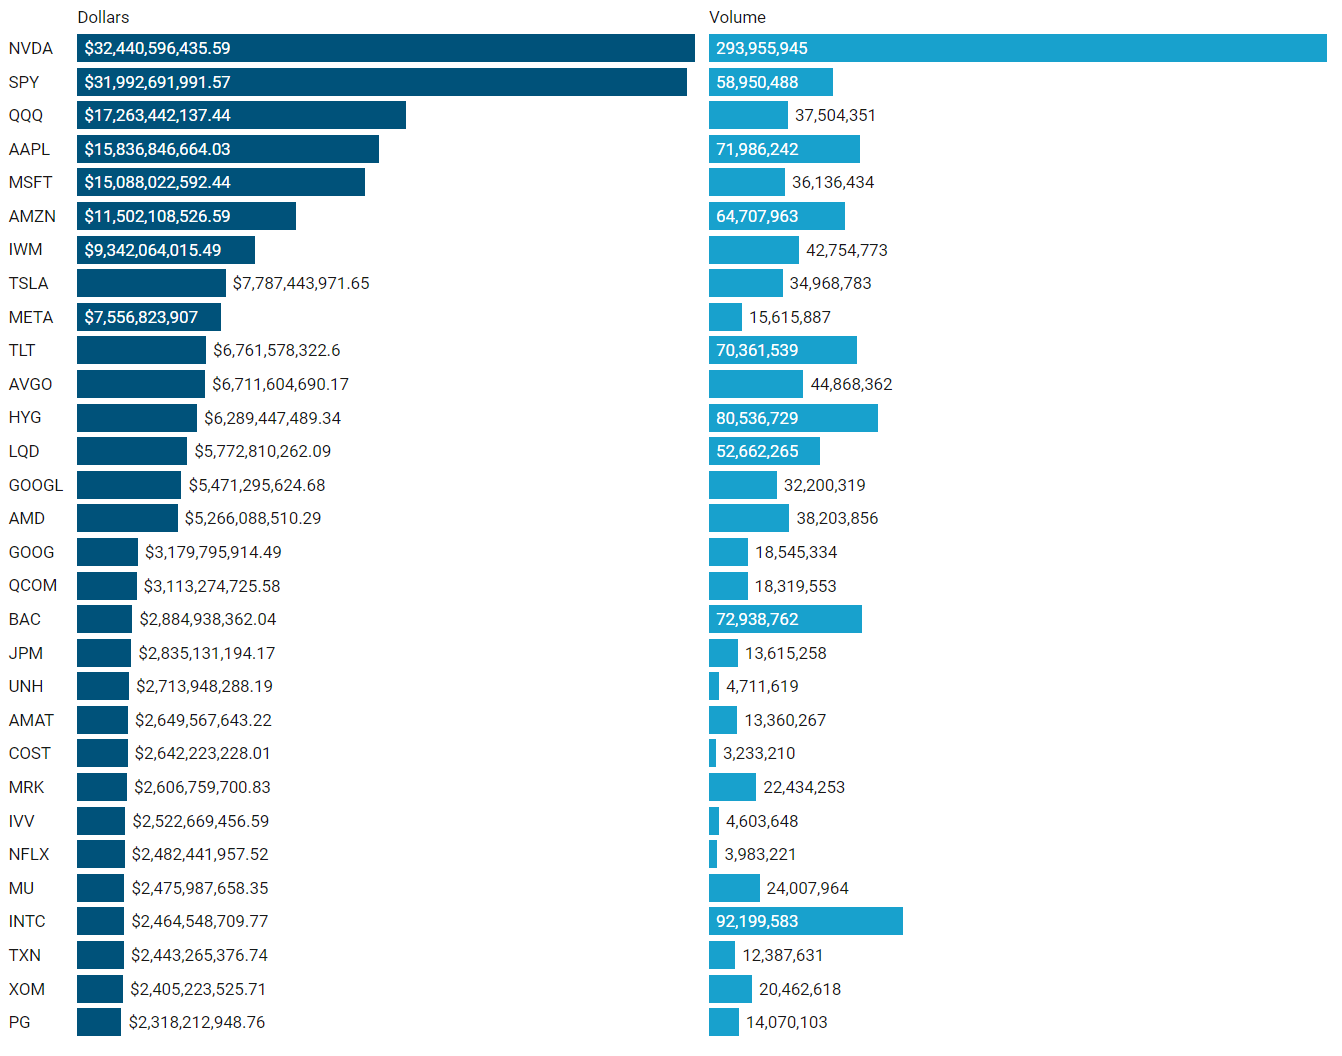
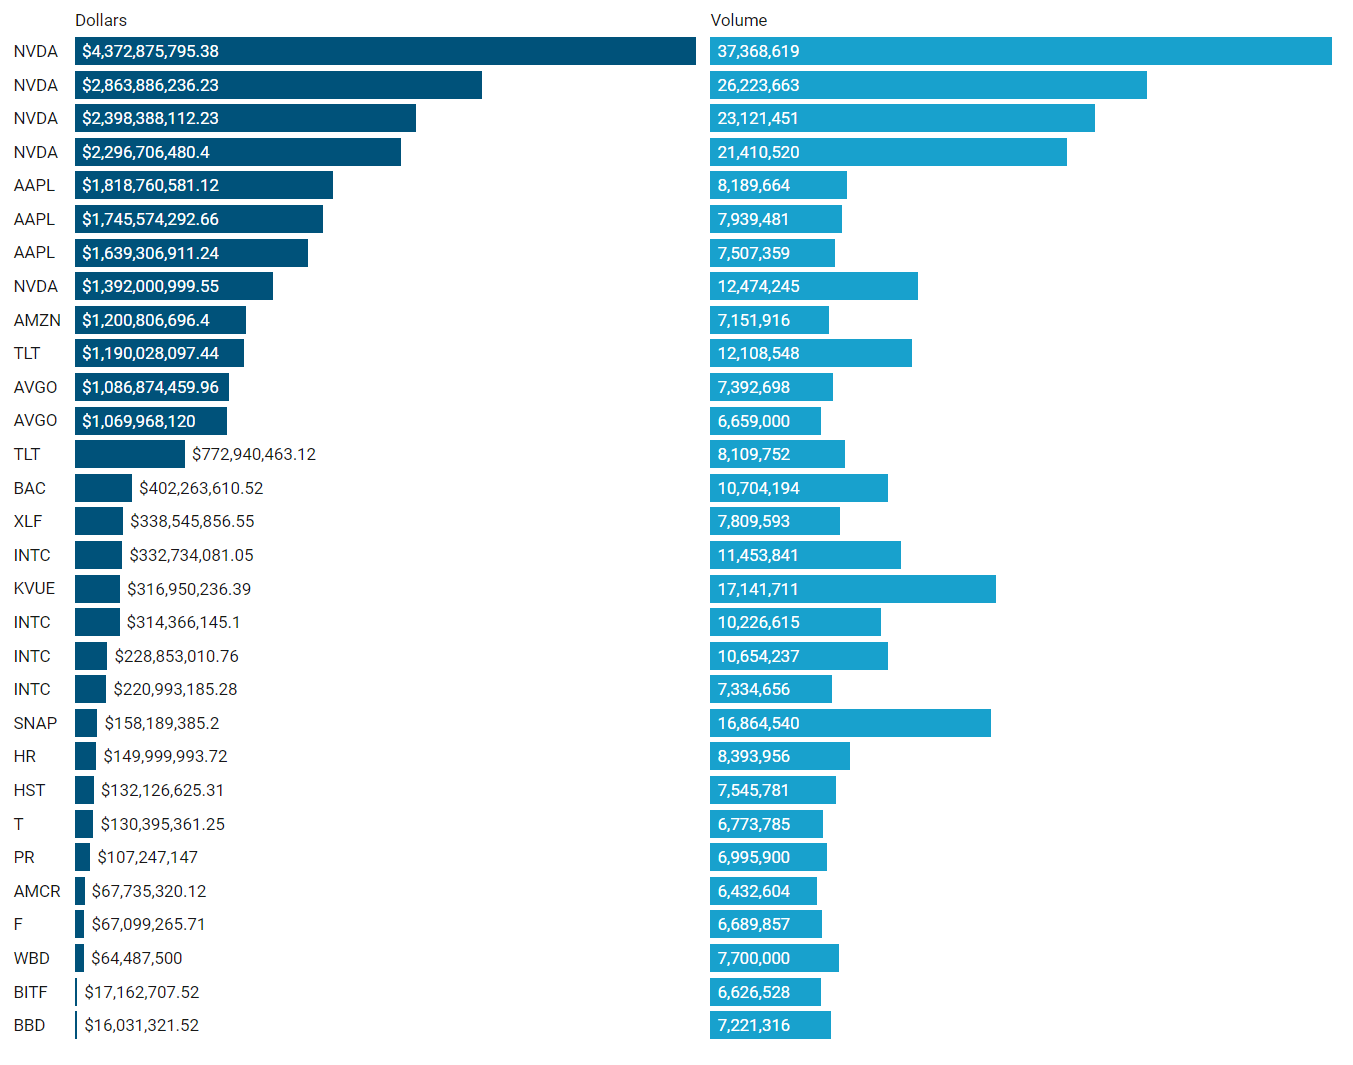
Largest Individual Trades By Dollars Transacted
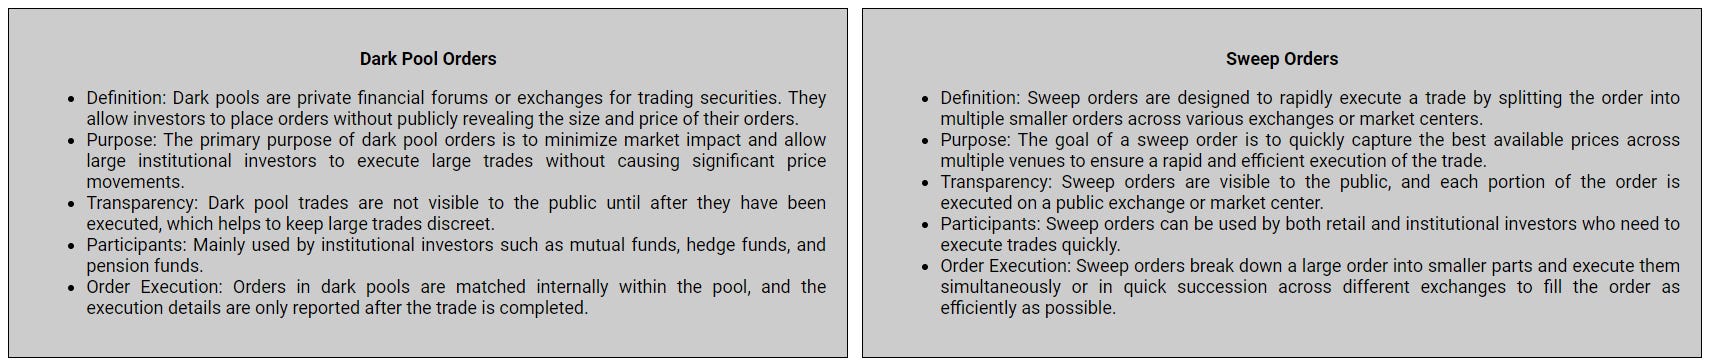
Top Aggregate Dark Pool Activity By Ticker
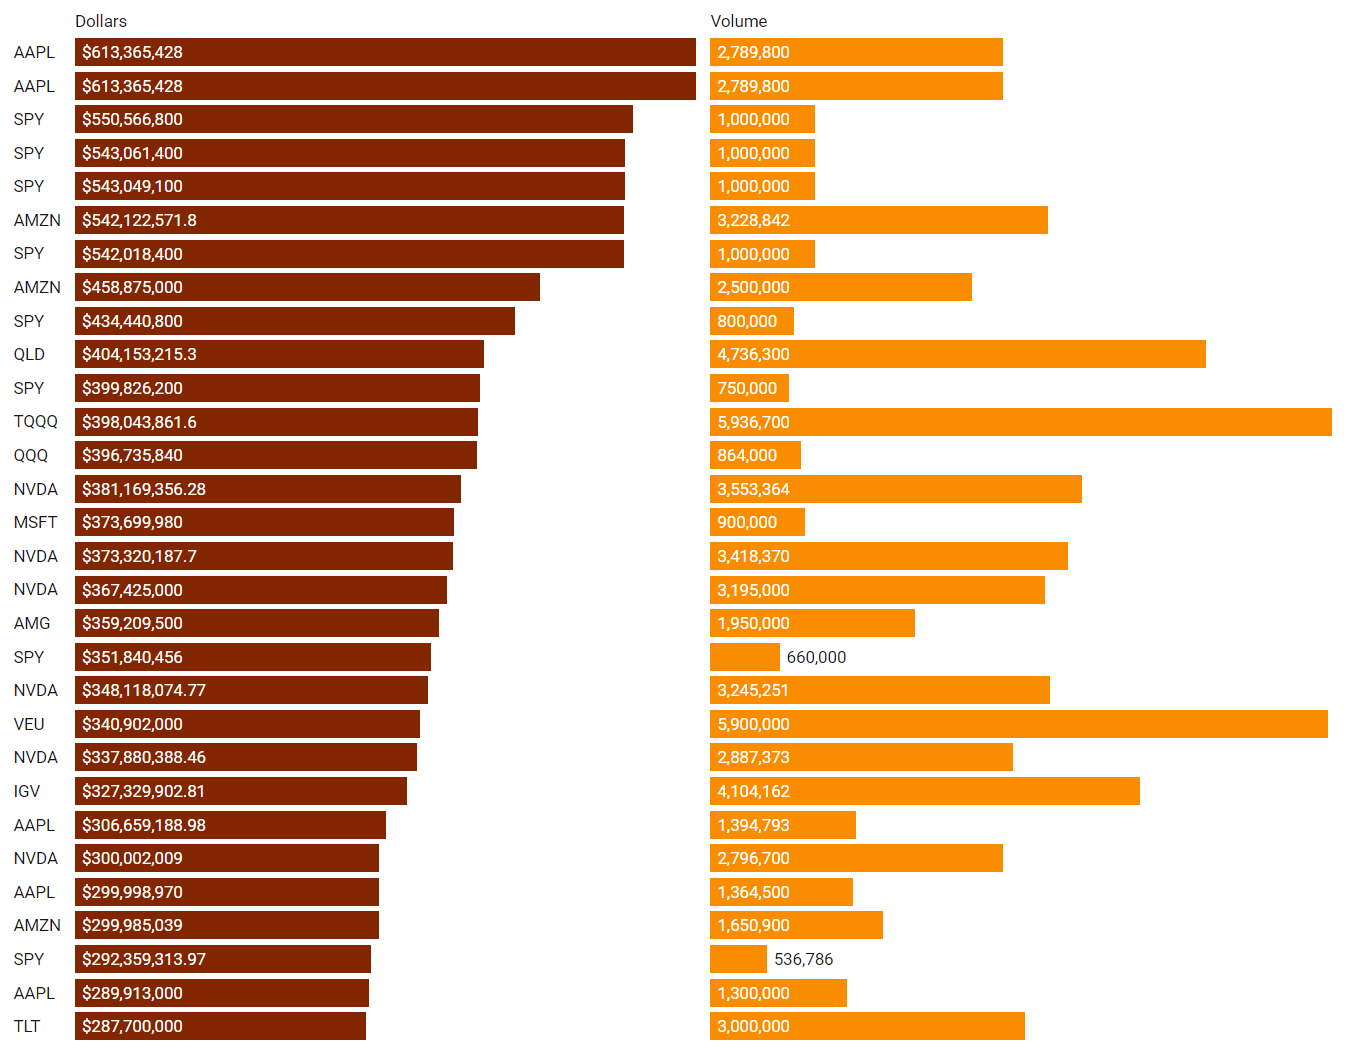
Largest Individual Dark Pool Blocks By Dollars
Top Aggregate Sweeps By Ticker
Top Individual Sweeps By Dollars Transacted
Institutional S/R Levels For Individual Tickers
Please read “Institutional S/R Levels For Major Indices” at the top of this stack to understand the nature and importance of what we’re looking at here visually. Institutions leave footprints that VL can illustrate for you while providing context to assess things like institutional conviction and urgency.
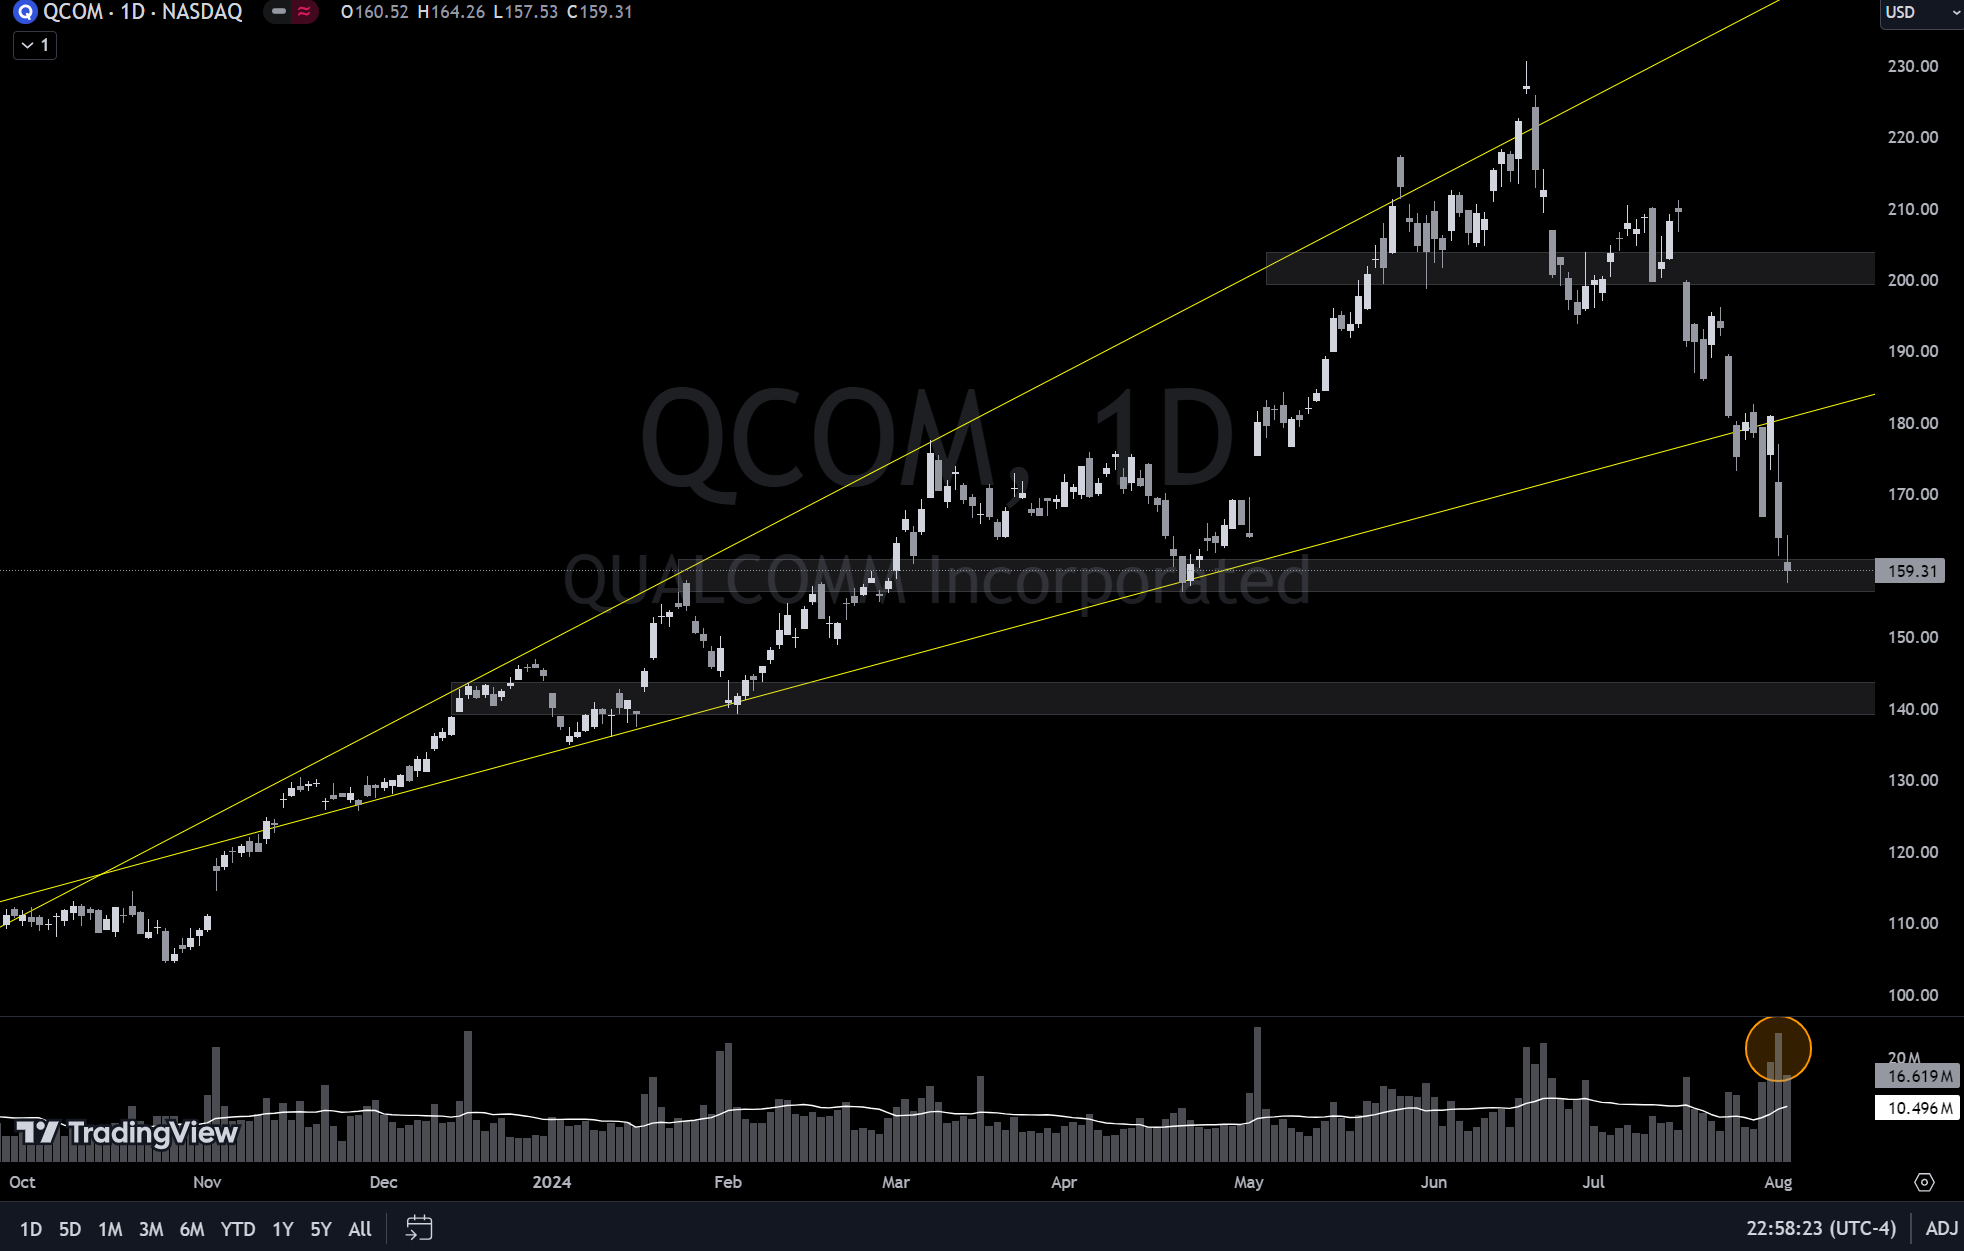
Qualcomm QCOM reported its third-quarter earnings, which were a key highlight for the company. The semiconductor giant exceeded analyst expectations, posting adjusted earnings per share (EPS) of $2.33, surpassing the consensus estimate of $2.24. Revenue for the quarter was also strong, coming in at $9.4 billion, slightly ahead of projections.
Qualcomm's performance was bolstered by a 12% year-over-year increase in its smartphone chip sales, which remains its largest and most crucial business segment. The company also reported better-than-expected results in its Internet of Things (IoT) and automotive sectors. These gains contributed to a positive outlook for the next quarter, with Qualcomm forecasting revenue above Wall Street estimates, driven by strong demand for high-end Android devices and anticipation of increased chip usage in smartphones.
Higher timeframe traders will note where we are on a daily chart - back into a prior area of demand and with significant volume coming in. I’m looking for a low to be struck at $153’ish, giving this make-or-break-zone a quick look below before a reclaim that would invite strength to see $210 again. In the absence of buyers at $153, good chance $140’ish is on-deck and that’s a good place to re-asses.
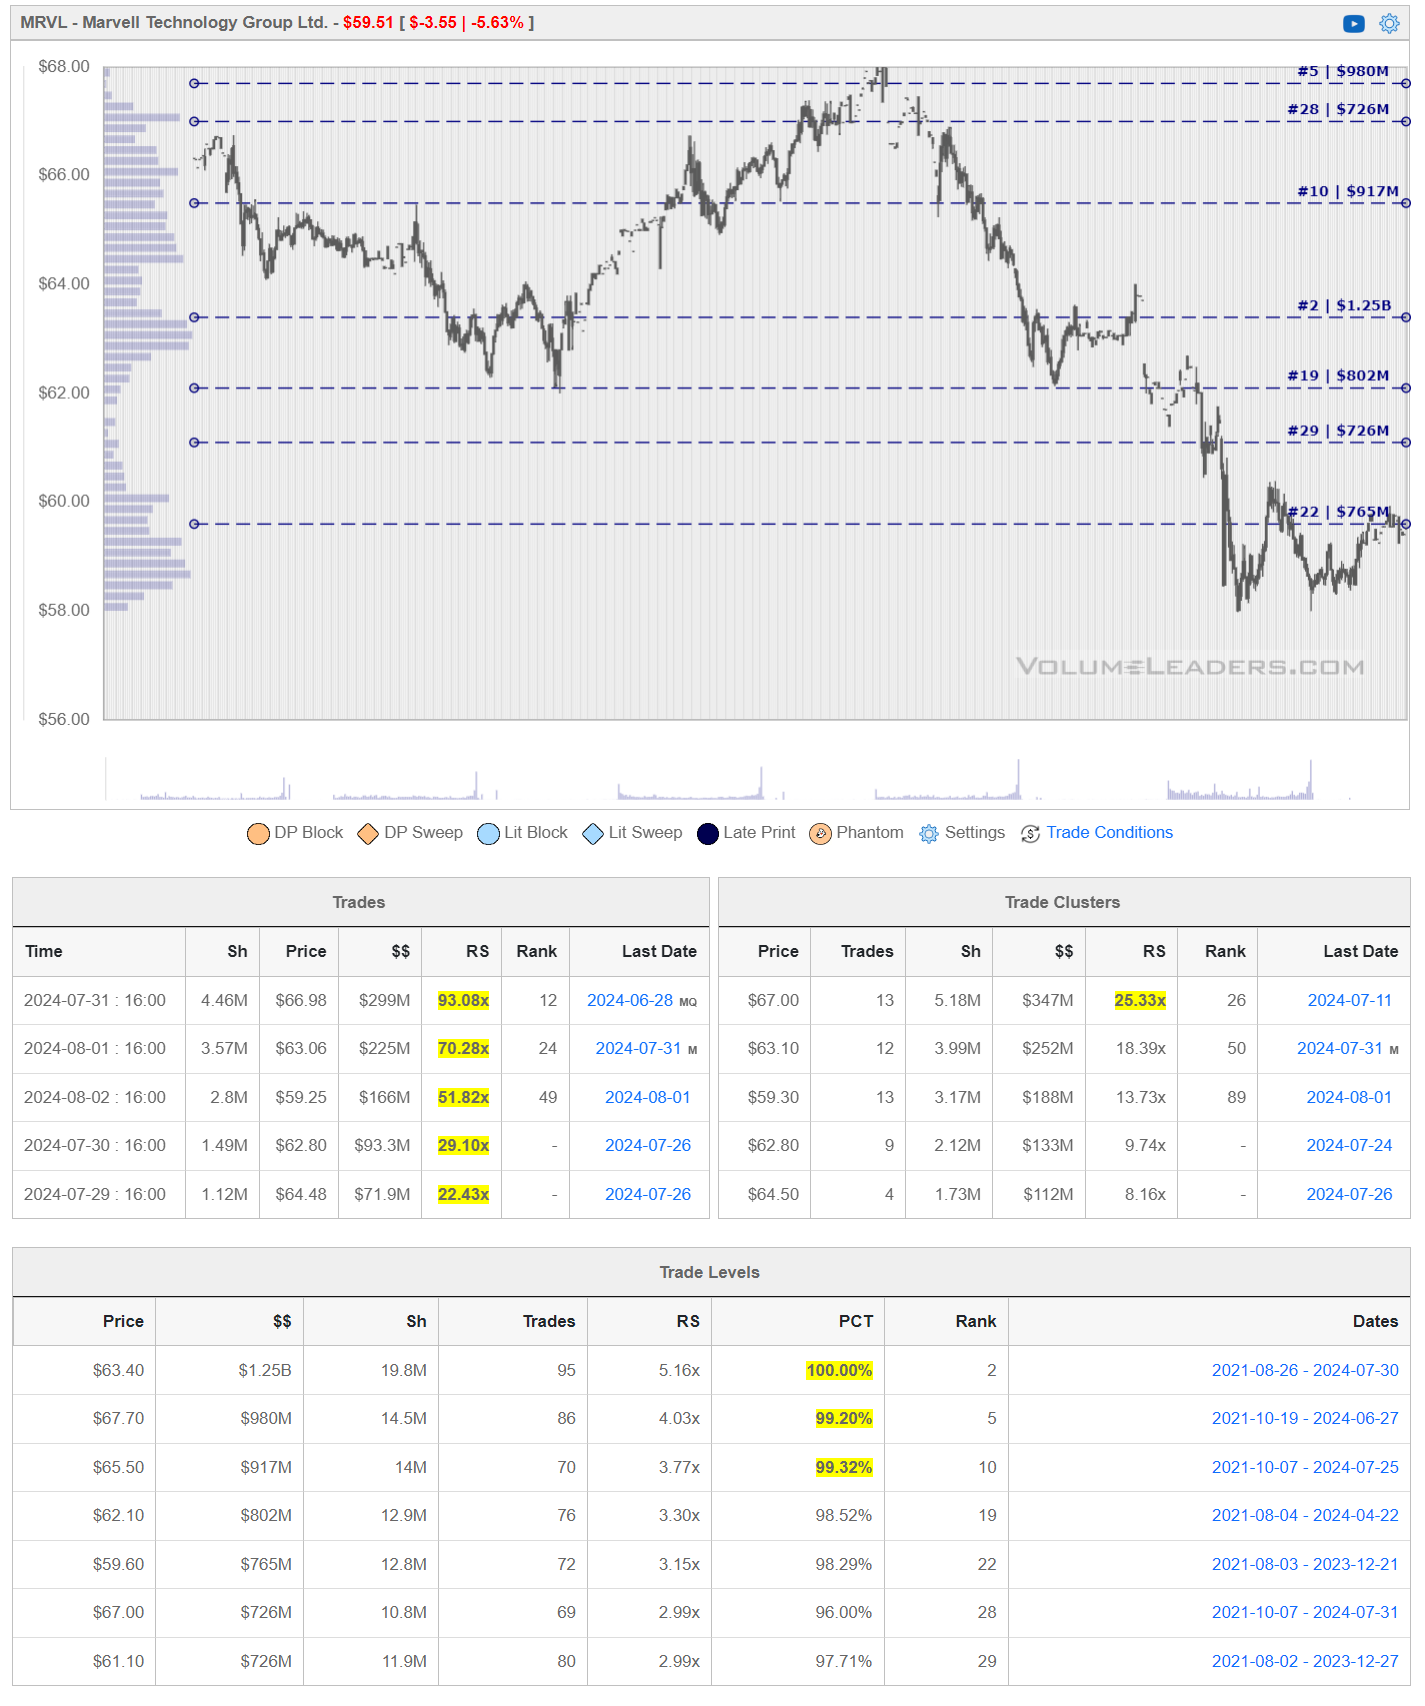
MRVL’s MRVL performance was influenced by market sentiment around the semiconductor sector, which included a mixed response to its recent product launches and market positioning. Marvell introduced its Structera CXL product line aimed at addressing server memory bandwidth challenges in cloud data centers, as well as announced the availability of its Teralynx 10 switch in open-source ecosystems.
Additionally, Marvell was highlighted by J.P. Morgan as a preferred chip stock, especially as part of the AI infrastructure boom. Despite these positive notes, the stock faced fluctuations, reflecting broader market volatility and investor reactions to the company's recent financial performance and forward guidance, finishing the week with a gap down.
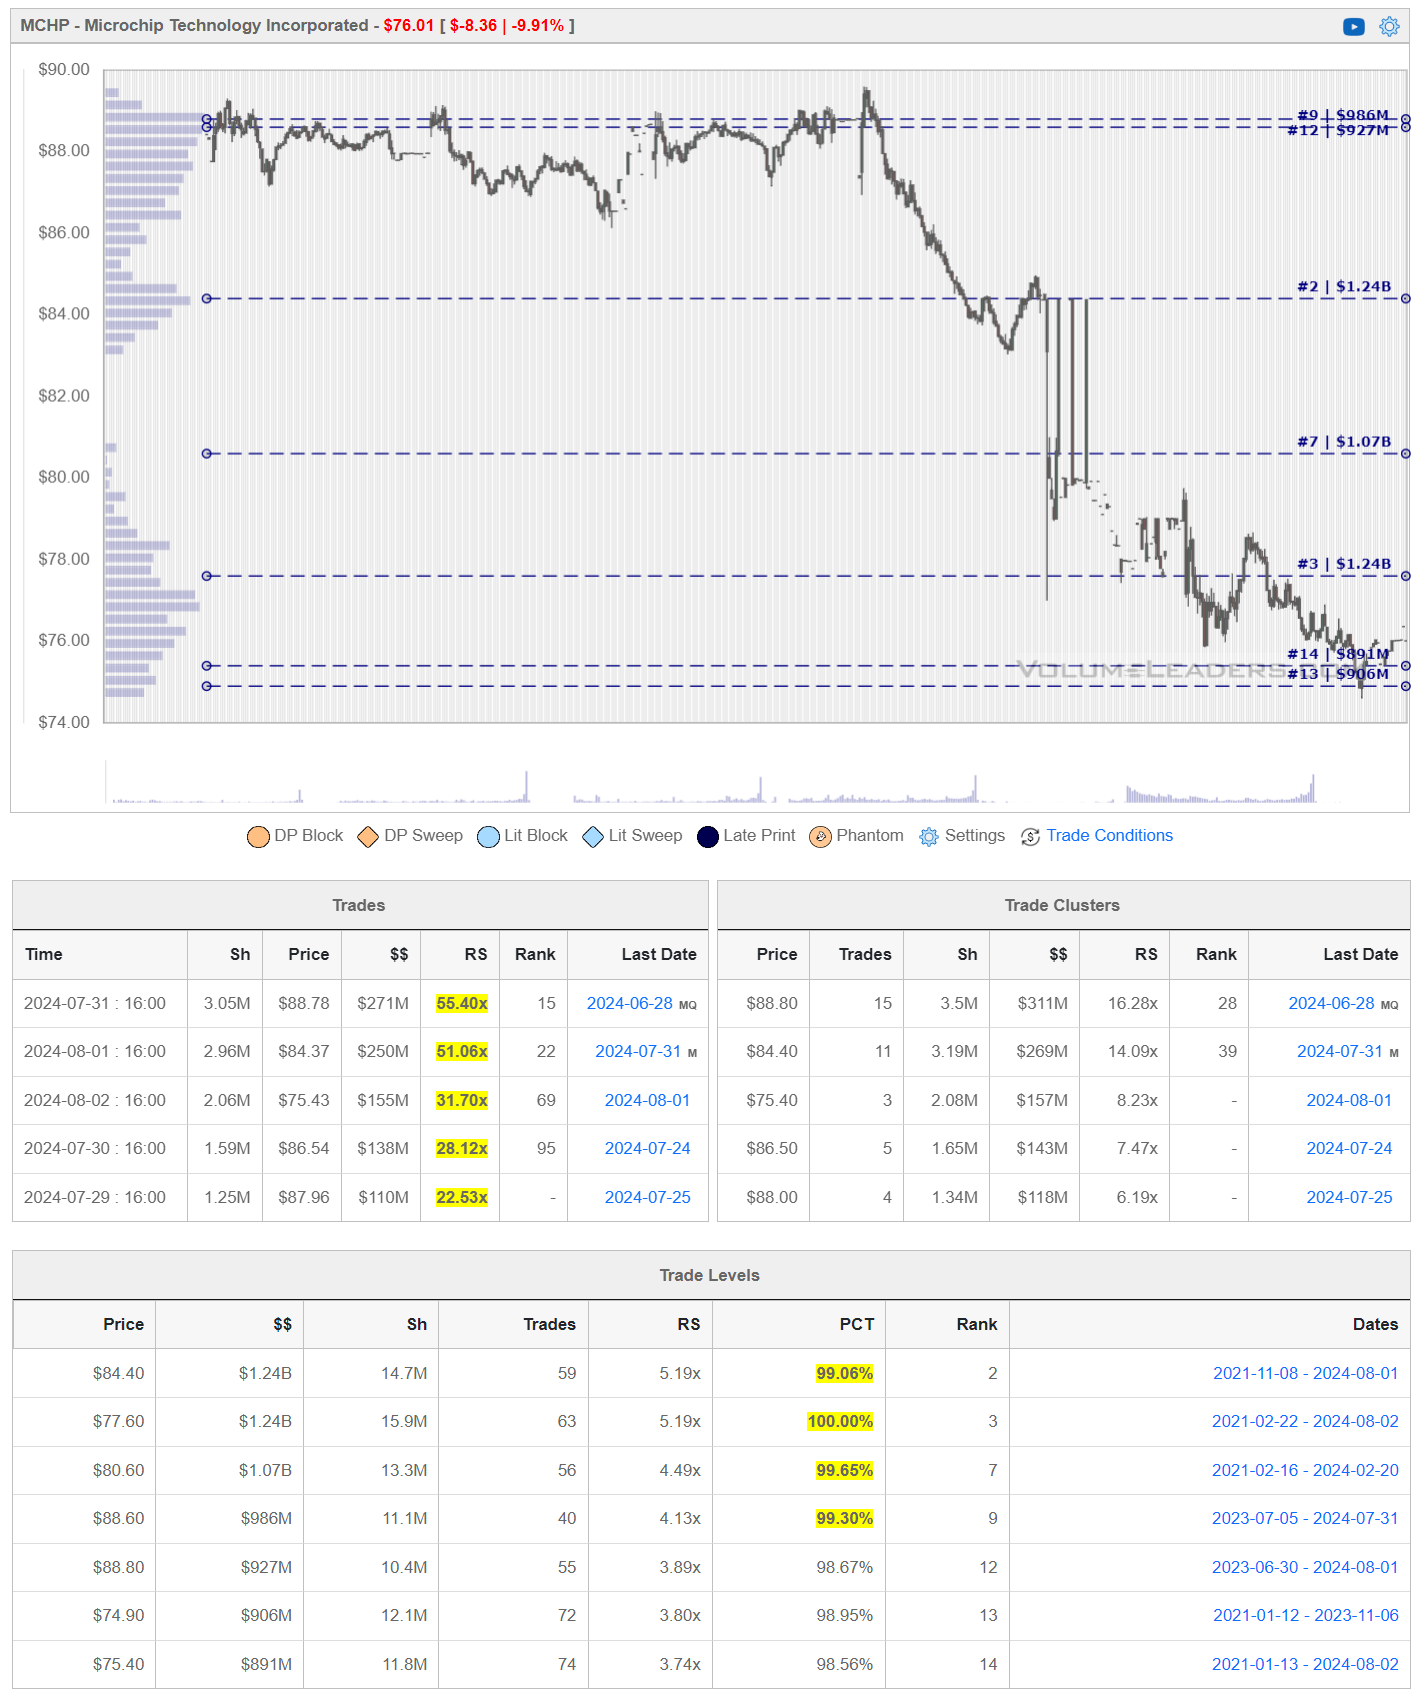
MCHP MCHP released its first-quarter fiscal year 2025 financial results. The company reported a decrease in revenue and earnings compared to the previous quarter, with notable weaknesses in the industrial and automotive sectors. This was largely attributed to customers clearing excess inventory, leading to softer demand. The company's leadership highlighted ongoing developments in key areas, including the introduction of new products like the dsPIC® Digital Signal Controller, aimed at enhancing real-time control in embedded systems. Microchip's focus on advancing its technology portfolio suggests a strategic shift towards capturing future growth opportunities in the semiconductor space.
Microchip announced that its first-quarter revenue was $1.161 billion, representing a 12% decline year-over-year. The company's earnings per share (EPS) also fell, reflecting the broader market challenges faced by the semiconductor industry. Despite these setbacks, Microchip raised its quarterly dividend by 10.7%, signaling confidence in its long-term prospects.
Analyst sentiment around Microchip was cautious, with some analysts lowering their forecasts due to the company's weaker-than-expected outlook for the next quarter.
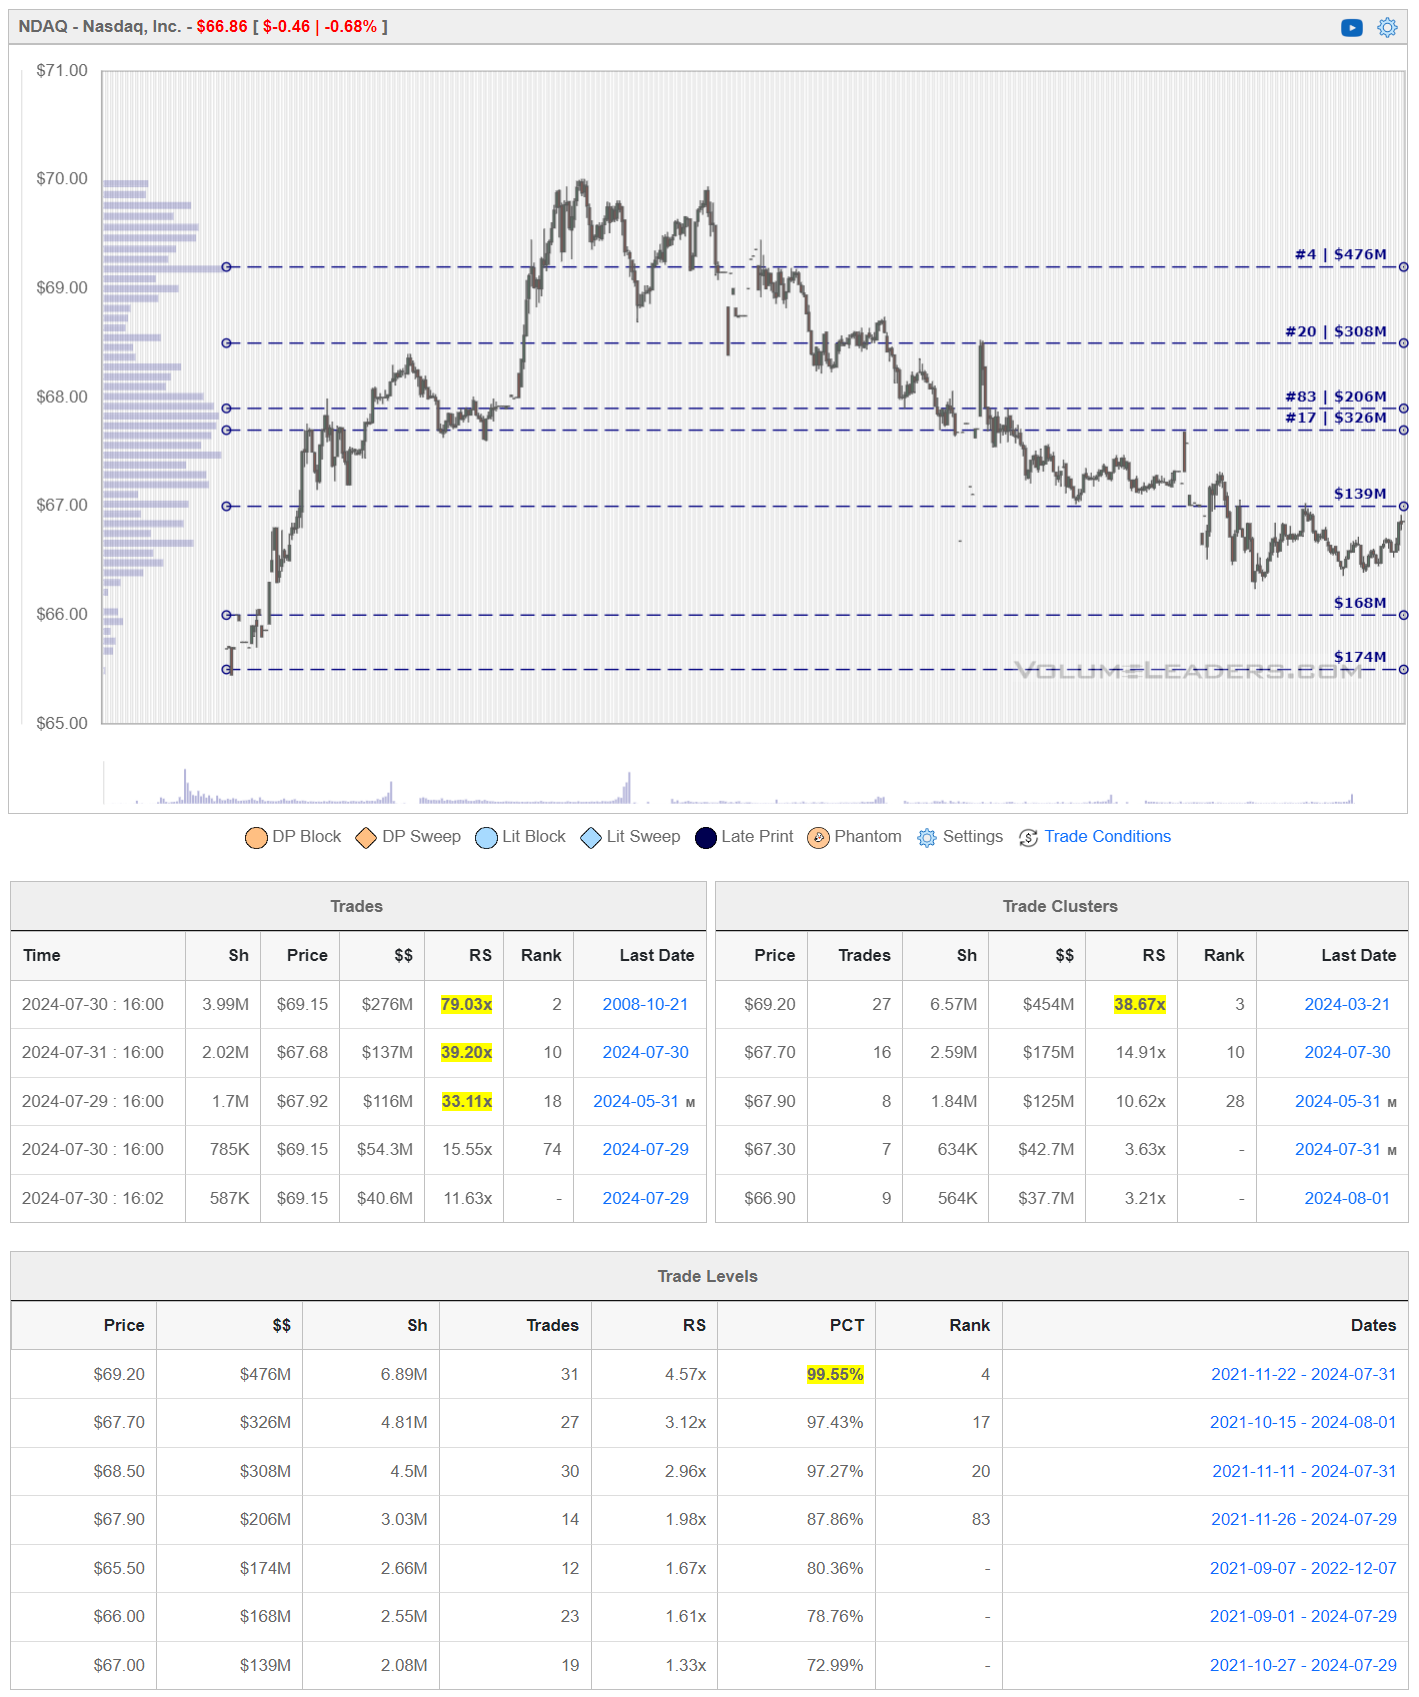
Nasdaq, Inc. NDAQ
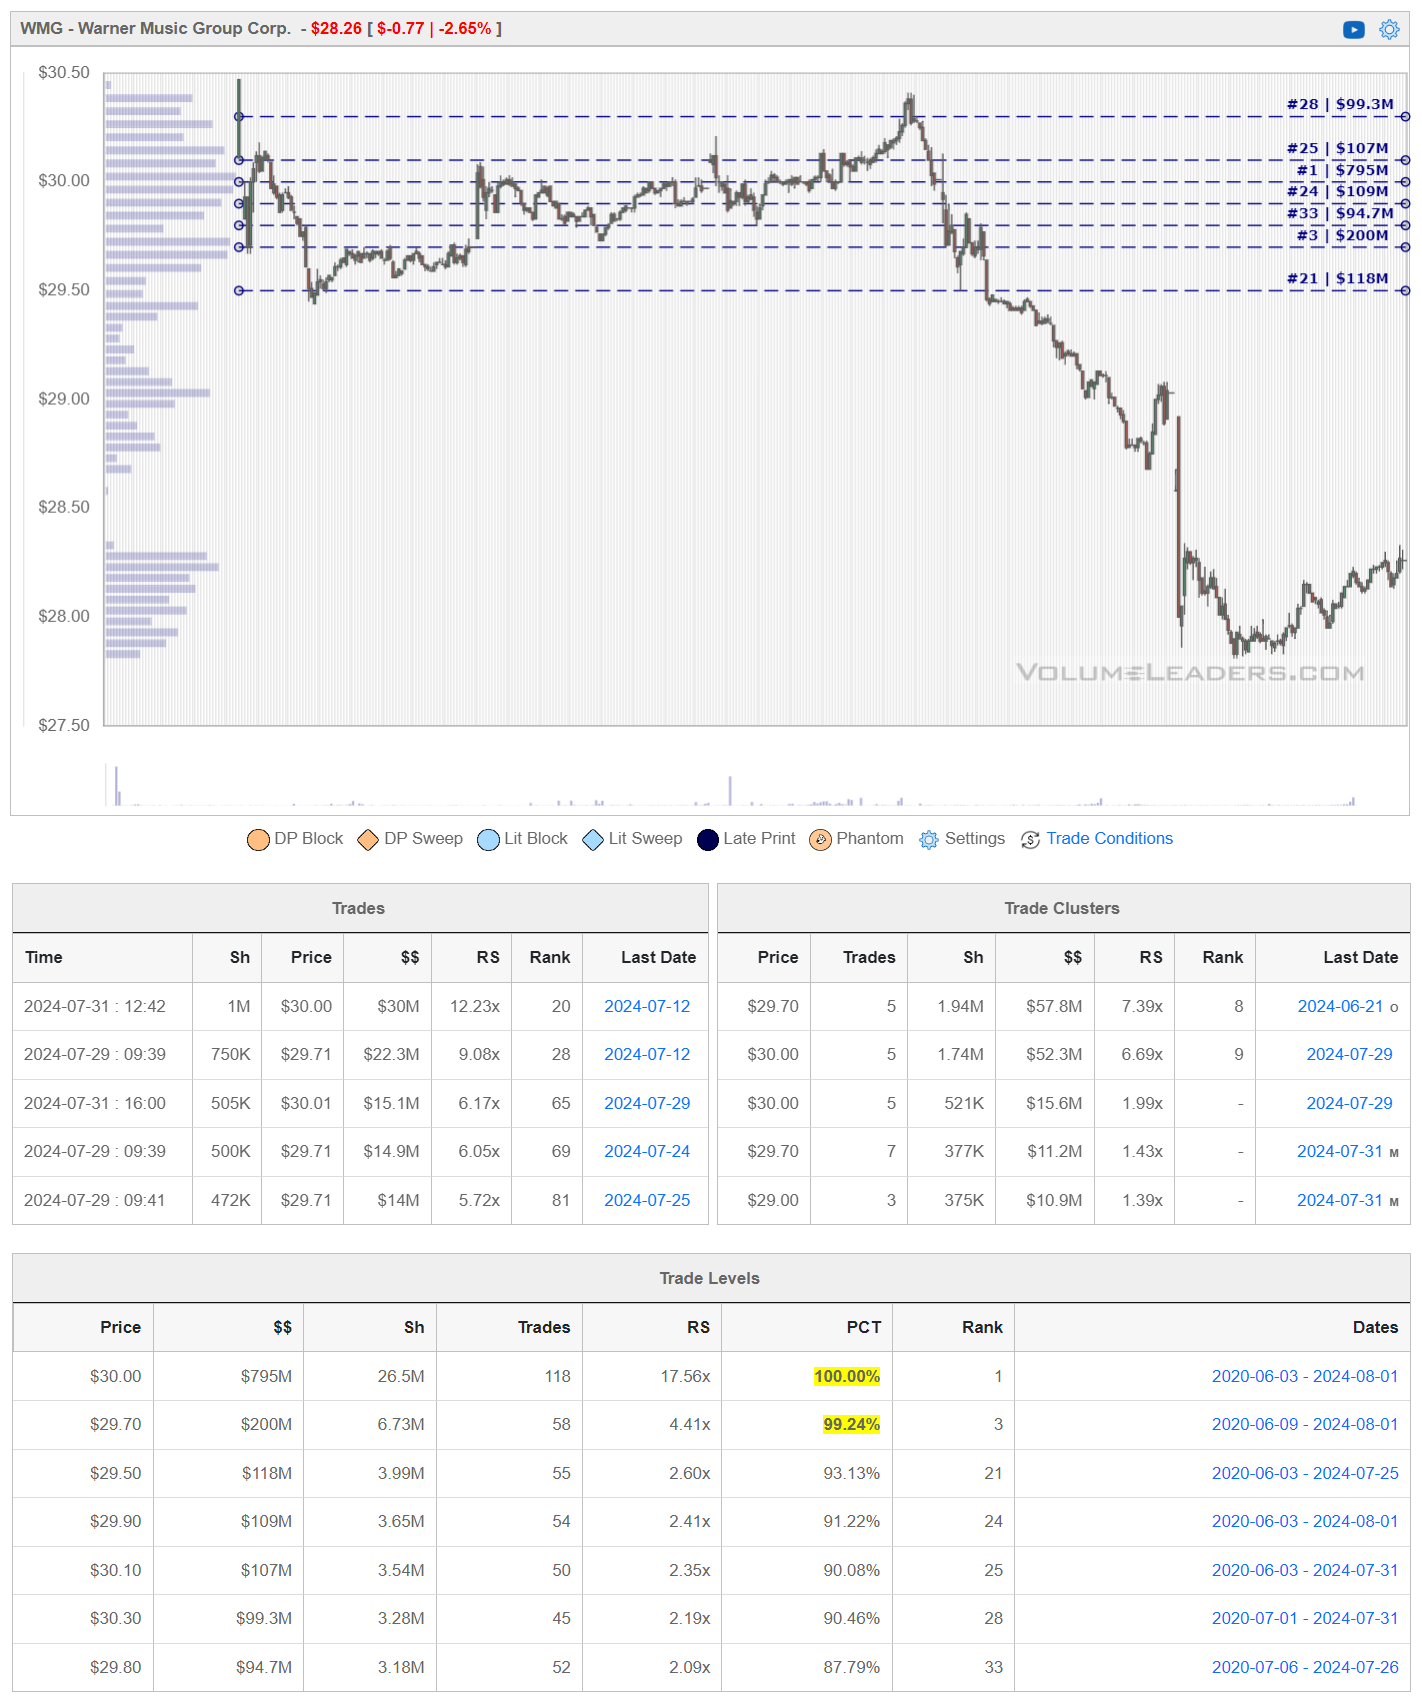
Warner Music Group Corp. WMG
WMG experienced volatility, influenced by both corporate decisions and broader market dynamics. A key highlight was the announcement of Max Lousada stepping down as CEO of the recorded music division at the end of the fiscal year. Lousada has been a significant figure at Warner Music Group, contributing to its success over the past two decades.
The company also announced a reorganization of its recorded music operations, aiming to streamline leadership and enhance creative regional leadership. This restructuring is part of Warner Music's strategy to adapt to the evolving music industry landscape, focusing on local music markets and digital streaming platforms.
Financially, Warner Music Group has shown resilience with steady revenue growth, despite challenges. For the fiscal second quarter, the company reported strong results driven by growth in subscription streaming and music publishing. However, the stock's performance was mixed, reflecting investor reactions to the executive changes and the overall market sentiment.
Overall, Warner Music Group is navigating a transformative phase, balancing strategic leadership changes with efforts to capitalize on digital and global music trends.
If you’re wondering when it’s going to be safe to get back into this pool (or any ticker you’re looking at), just zoom out to a higher timeframe in VL and identify where institutions are positioned:
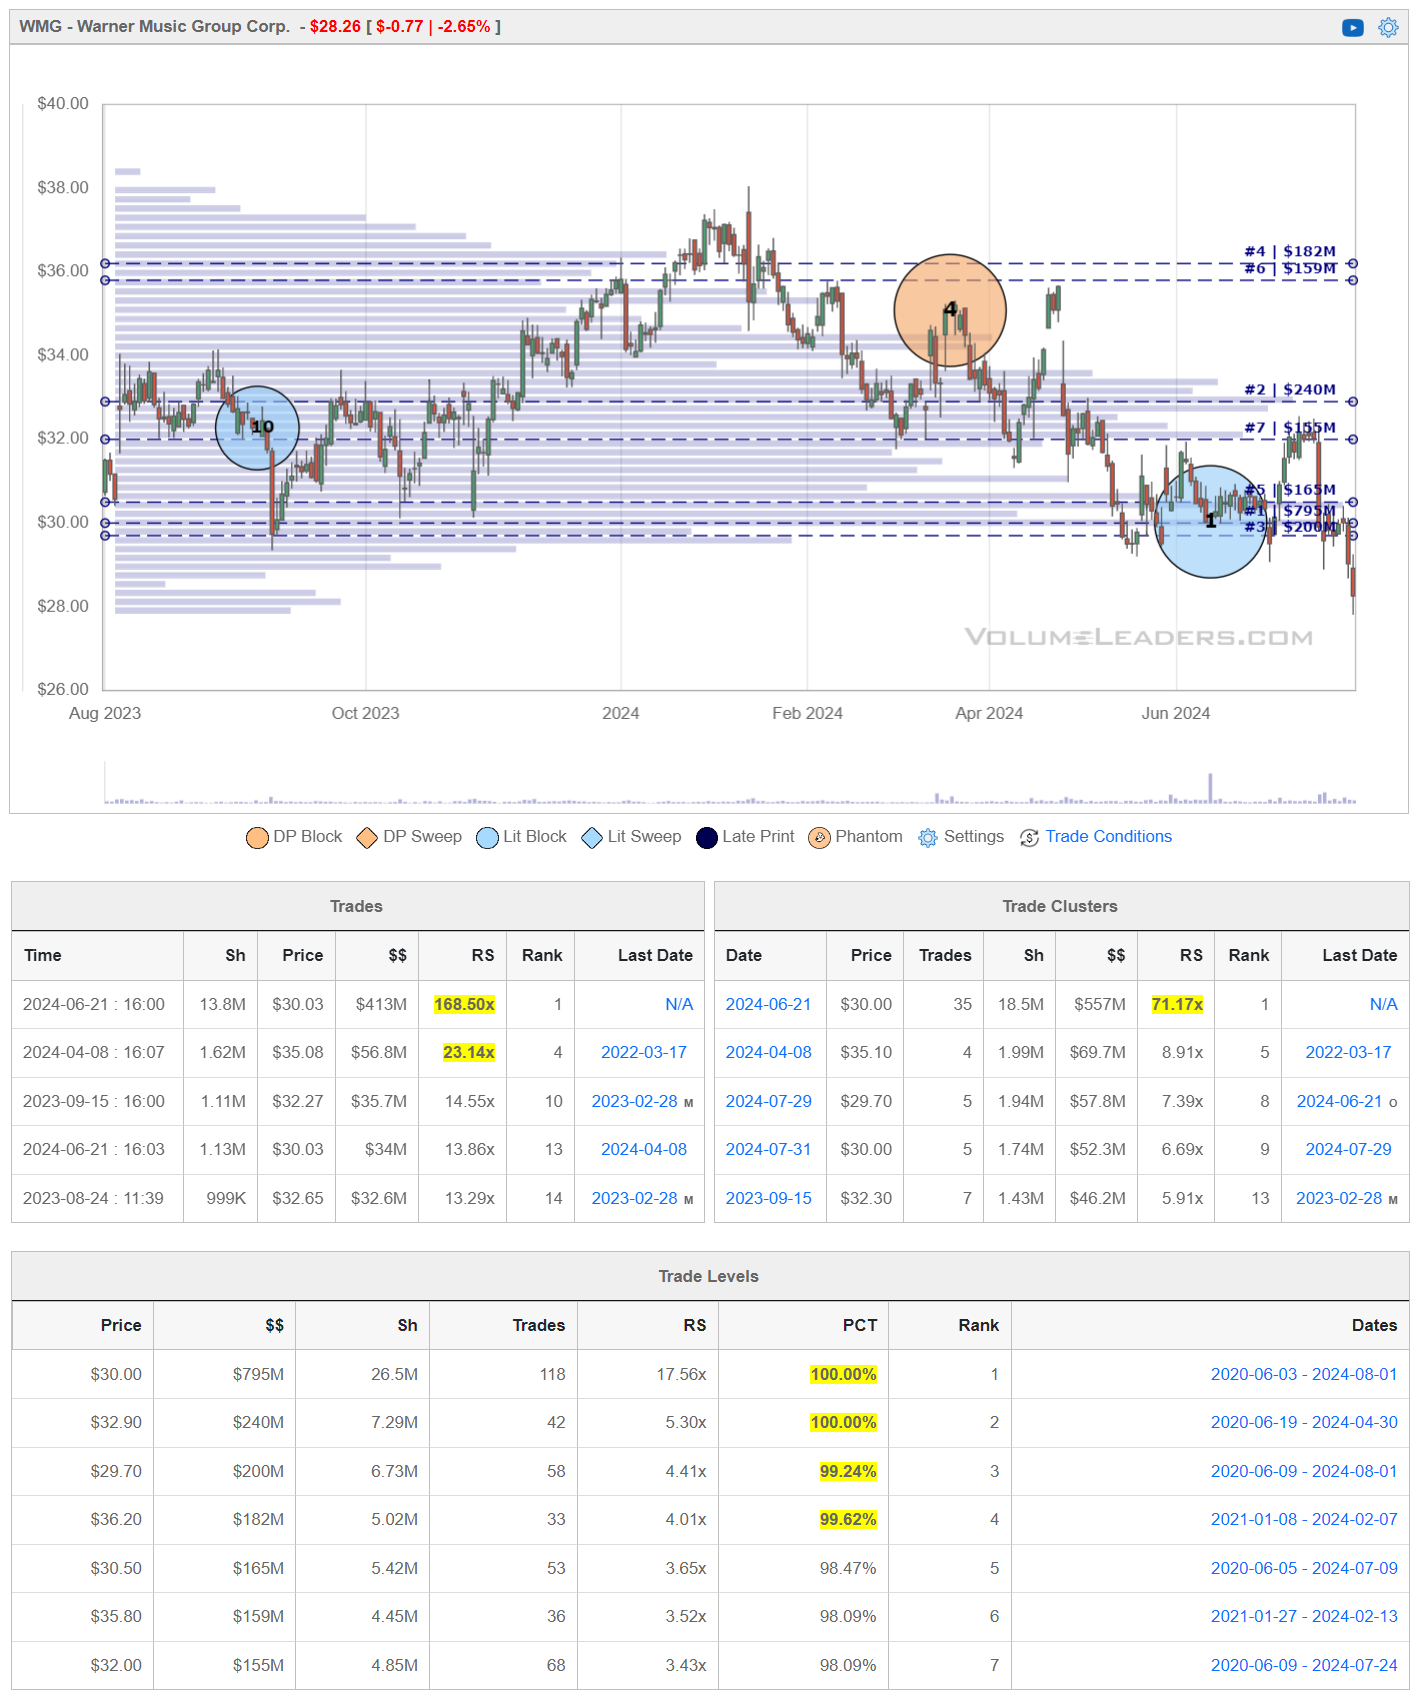
That #1 print at $30.03 sticks out like a sore thumb to me and I’ve found that I sometime endure far more pain bottom-picking than just waiting a tiny bit for confirmation. If I wait for a reclaim, I’ve missed virtually none of the trend, endured none of the pain and kept my capital free for other opportunities until the one I was stalking was ready. My recommendation here is to lean long on institutional positioning when price is above and right now, we’re clearly under lower timeframe and higher timeframe players.
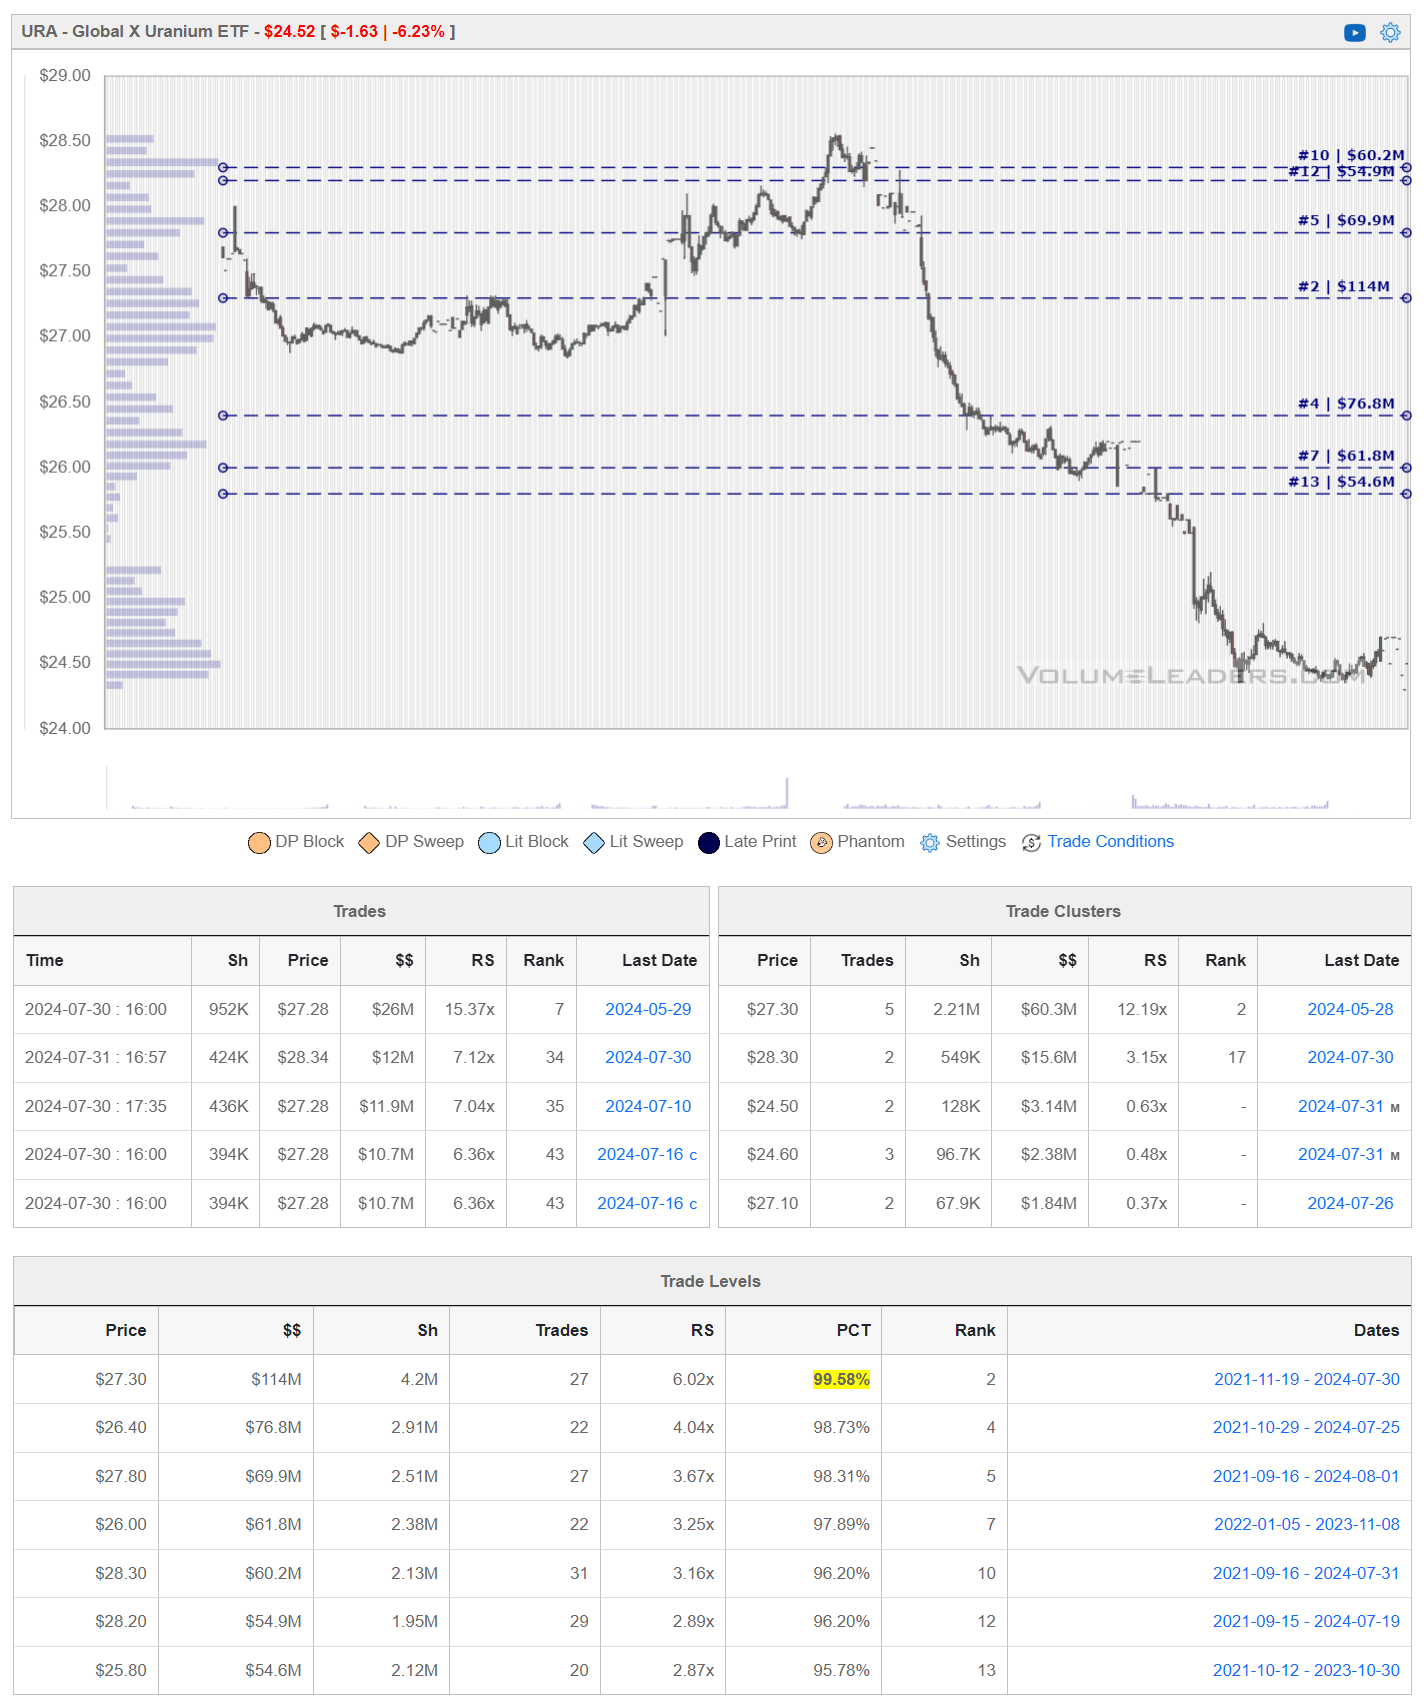
Global X Uranium ETF URA
Like so many tickers we’re looking at across the board, this one also into a large demand zone on higher timeframes. Here are some lower timeframe references from this past week but pull up the dailies on everything you’re doing homework on this weekend and see for yourself.
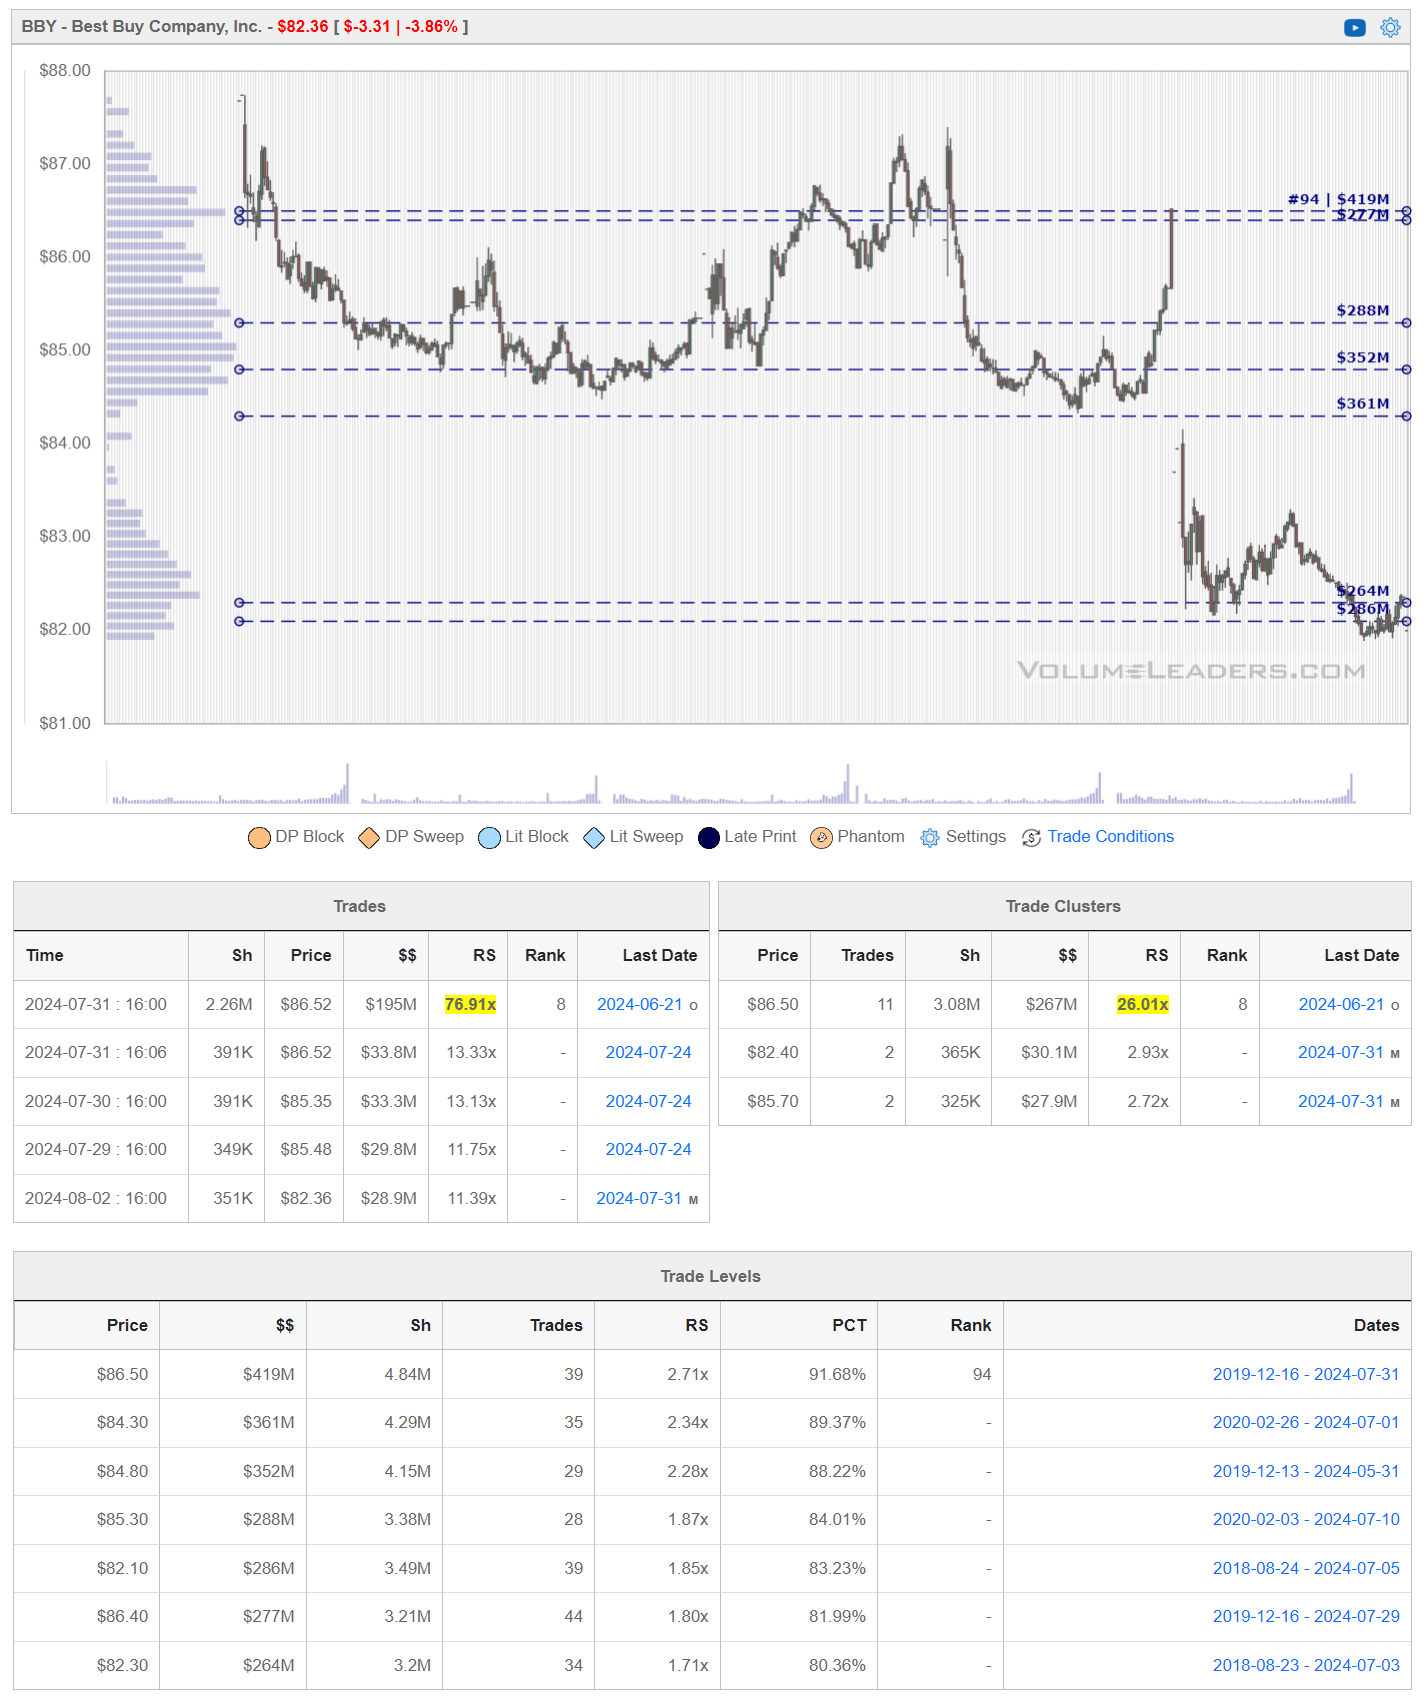
Best Buy Co. BBY
Best Buy has been focusing on strengthening its position in the consumer electronics retail sector, a move that has been positively received by analysts. The company's earnings per share (EPS) stood at $1.14, indicating a better-than-industry performance. However, the overall market sentiment and concerns about consumer spending trends have influenced the stock's recent movements.
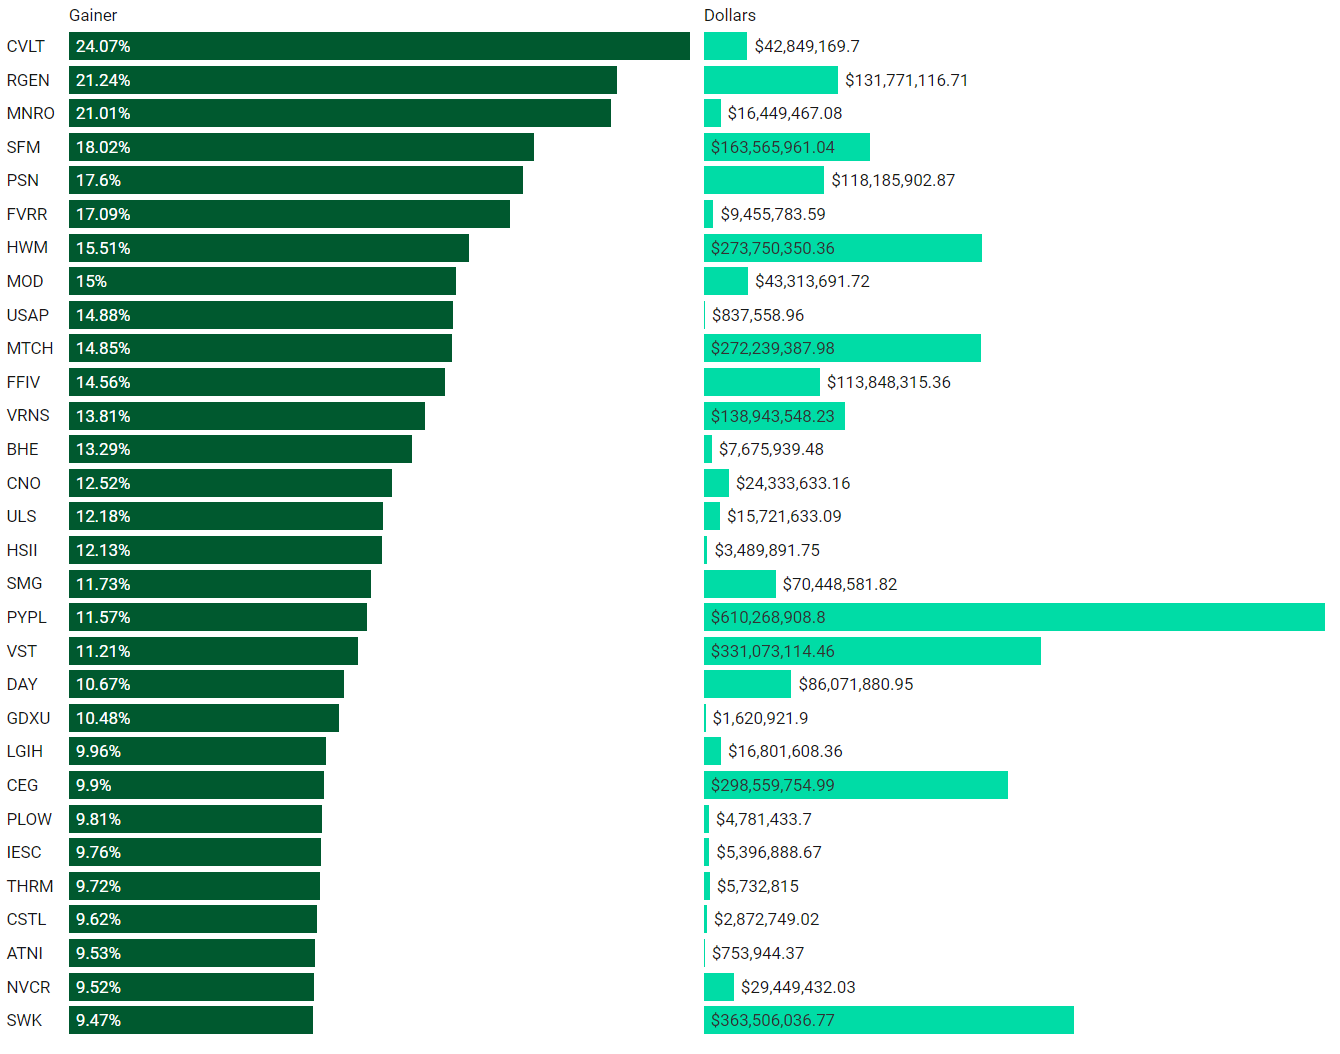
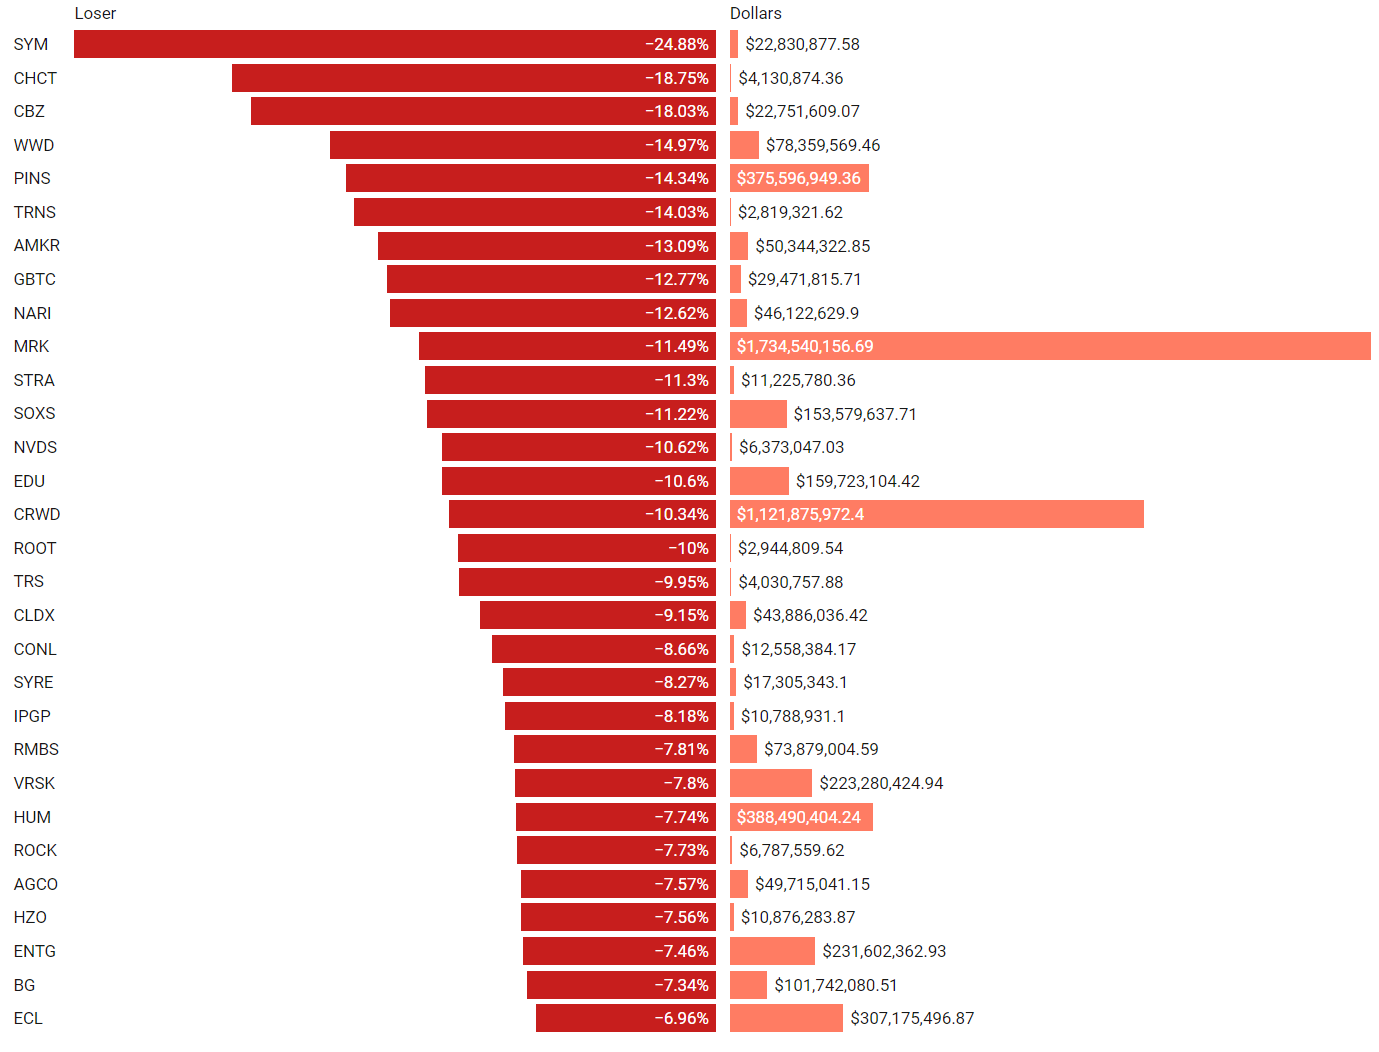
Institutionally-Backed Gainers & Losers
If you’re going to bet on a horse, consider one that is officially endorsed by an institution! These are the top percent gainers (green) and and percent losers (red) from this week’s open-to-close that had a trade price greater than $20 and institutional involvement. Continue watching tickers from prior stacks as these frequently turn into multi-leg trades with a lot of movement!
Top Institutionally Backed Gainers
Top Institutionally Backed Losers
Get these screened tickers in your inbox every week, just subscribe for free below.
Billionaire Boys Club
Tickers that printed a trade worth at least $1B last week get a special shout-out. Welcome to the club. The table below is sortable, searchable and paginated (if there are enough results; some weeks are busier than others). Login to VL to get the exact trade price and relevant institutional levels around the trade.
Summary Of Thematic Performance YTD
VL provides a lot of pre-built filters for thematics so that you can quickly dive into specific areas of the market. These performance overviews are provided here only for inspiration. Consider targeting leaders and/or laggards in the best and worst sectors, for example.
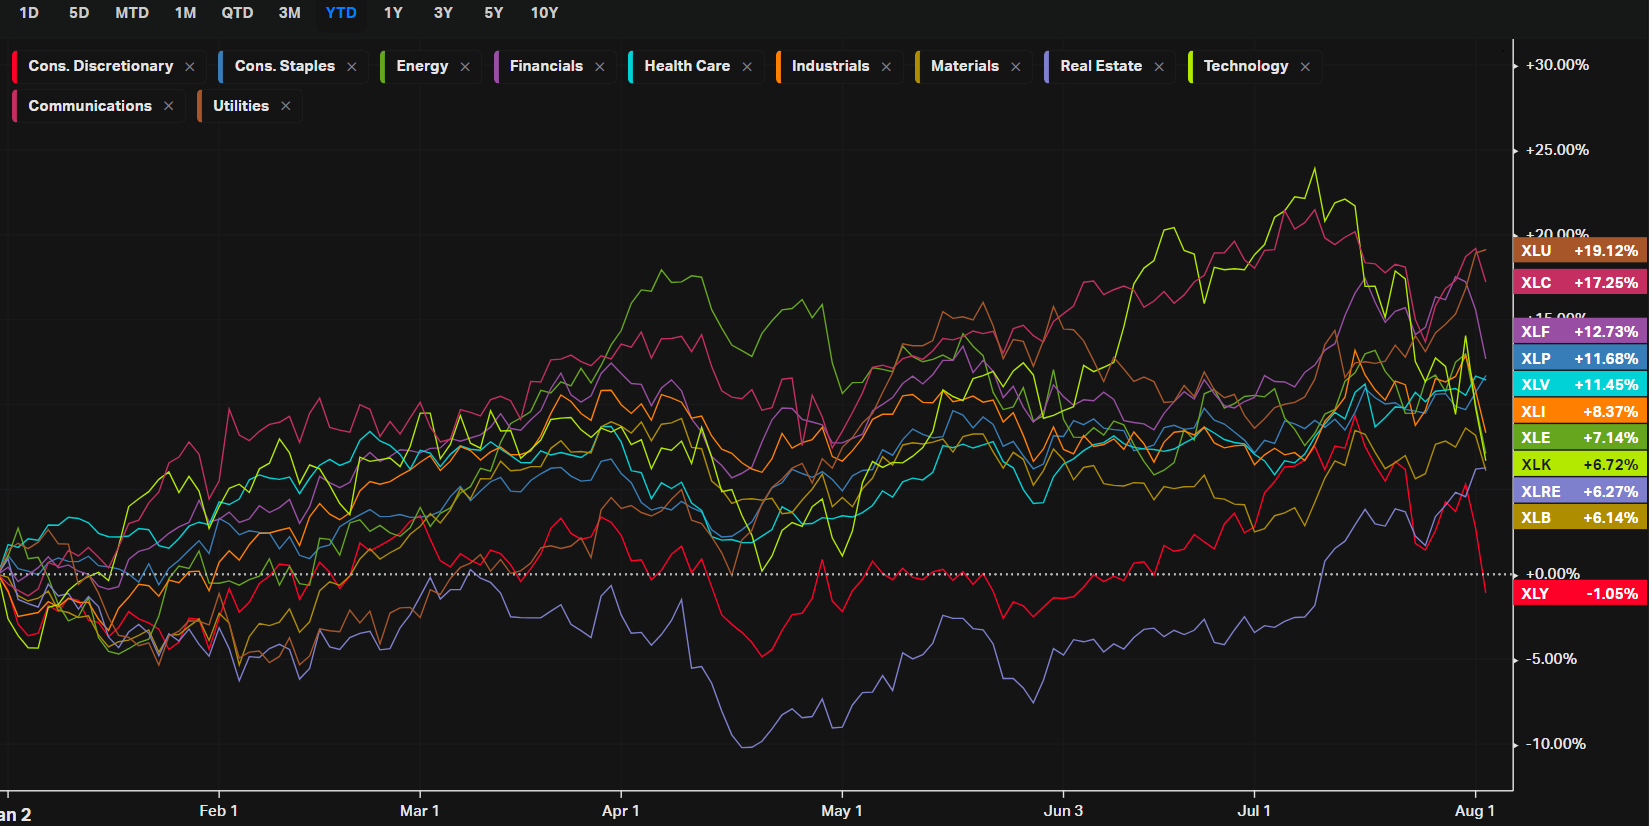
S&P By Sector
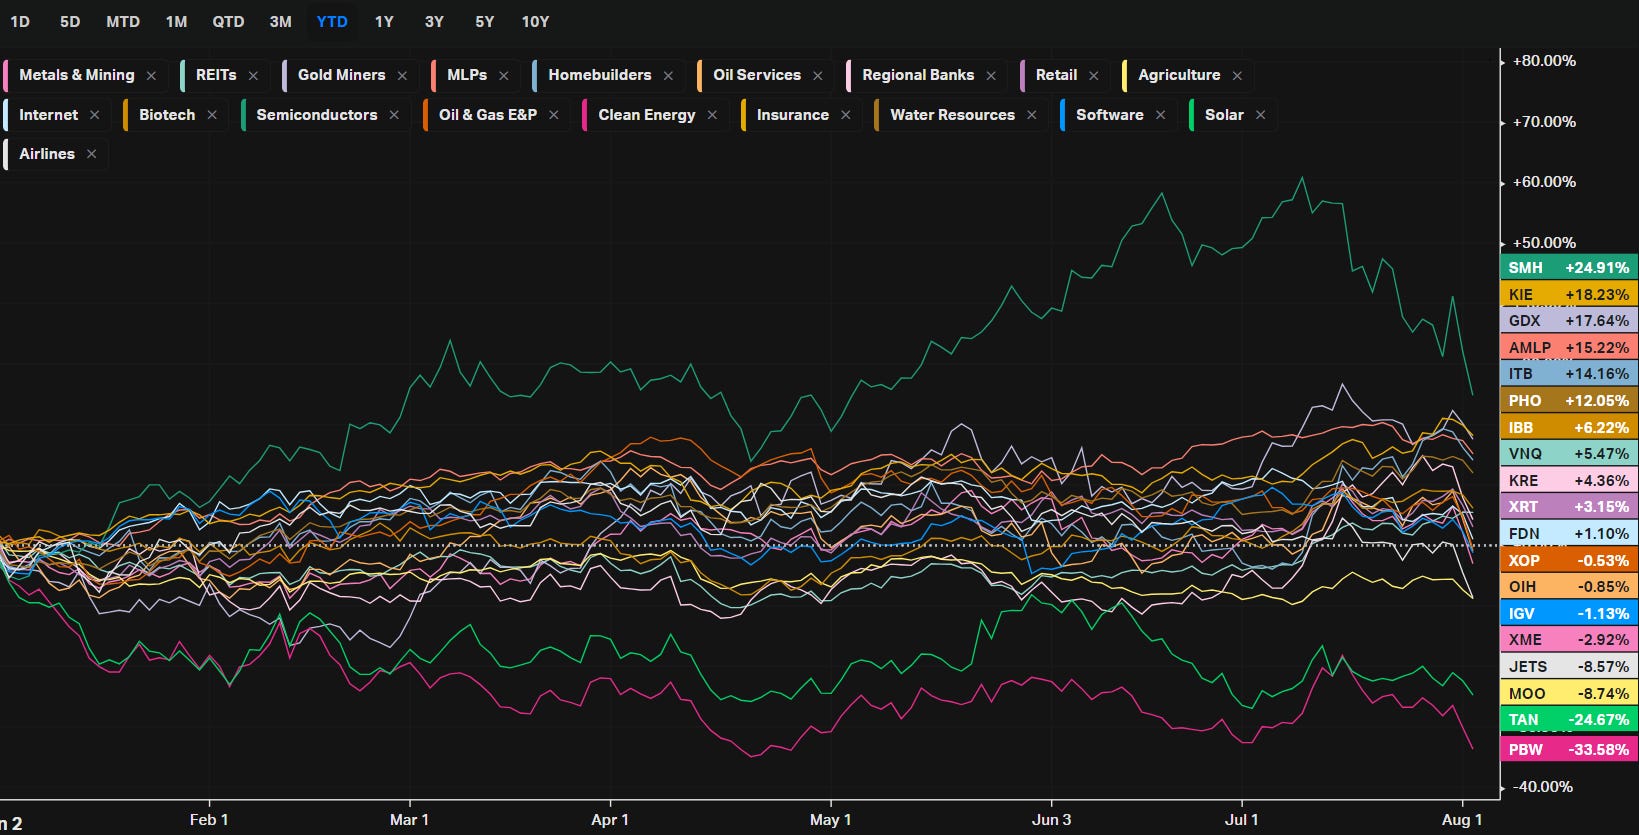
S&P By Industry
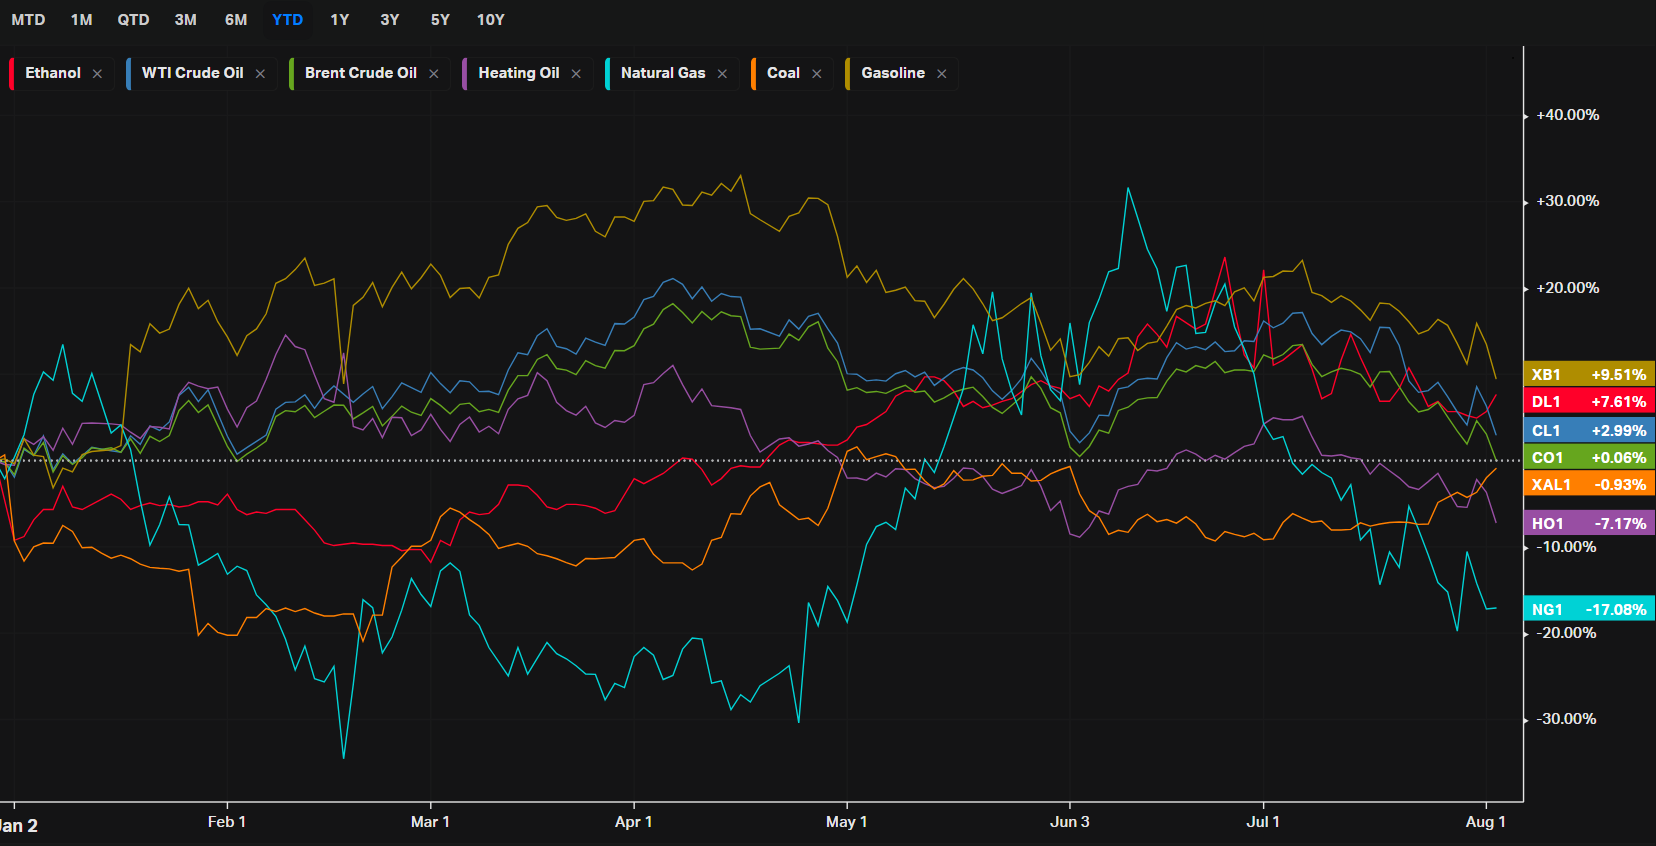
Energy
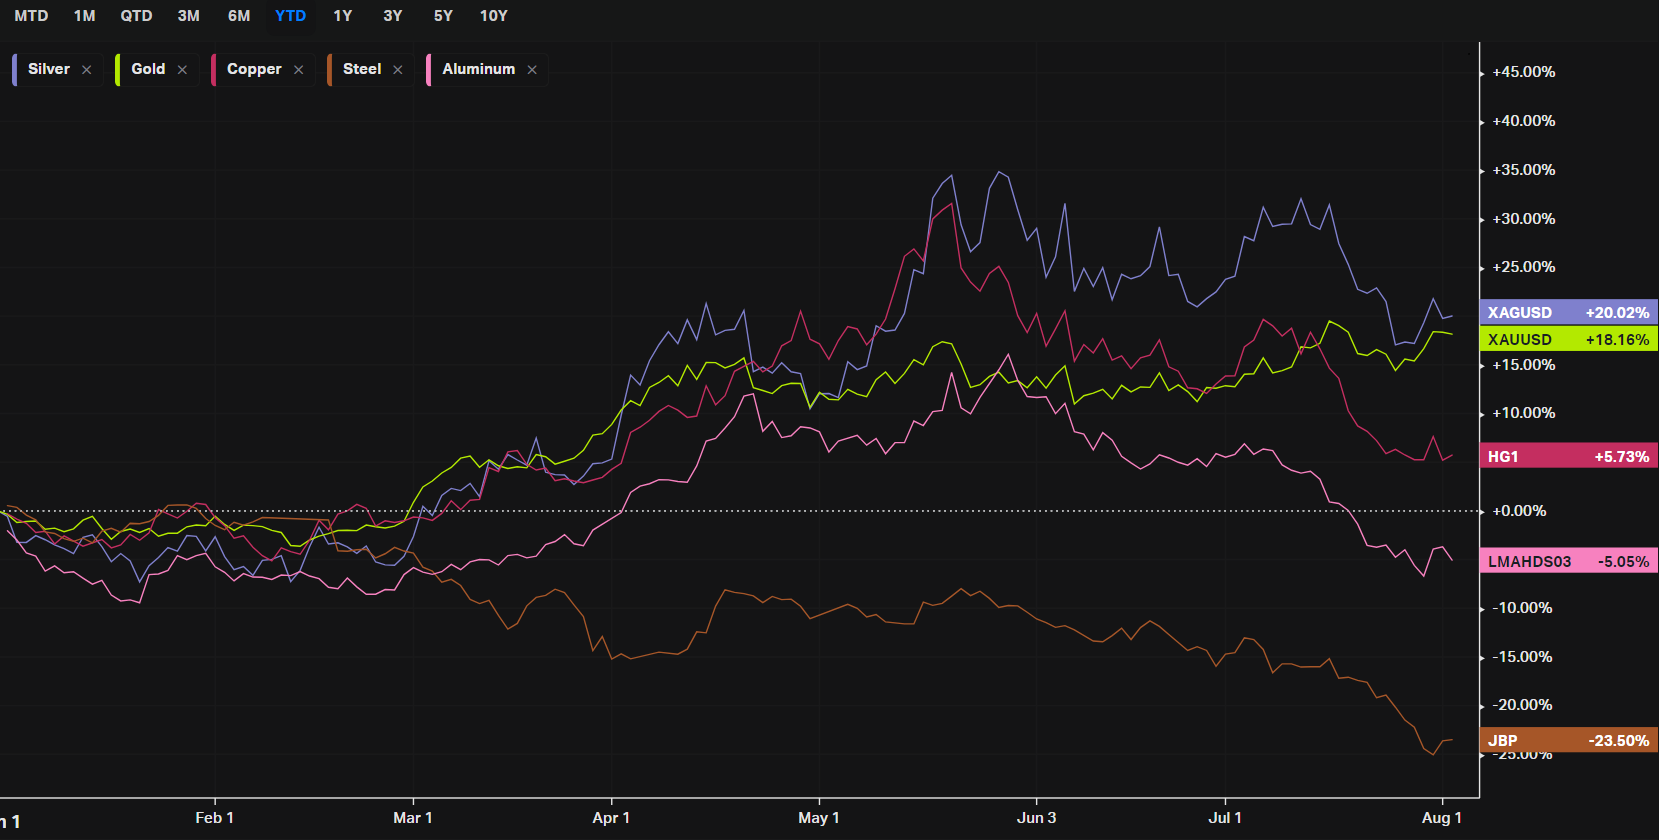
Metals
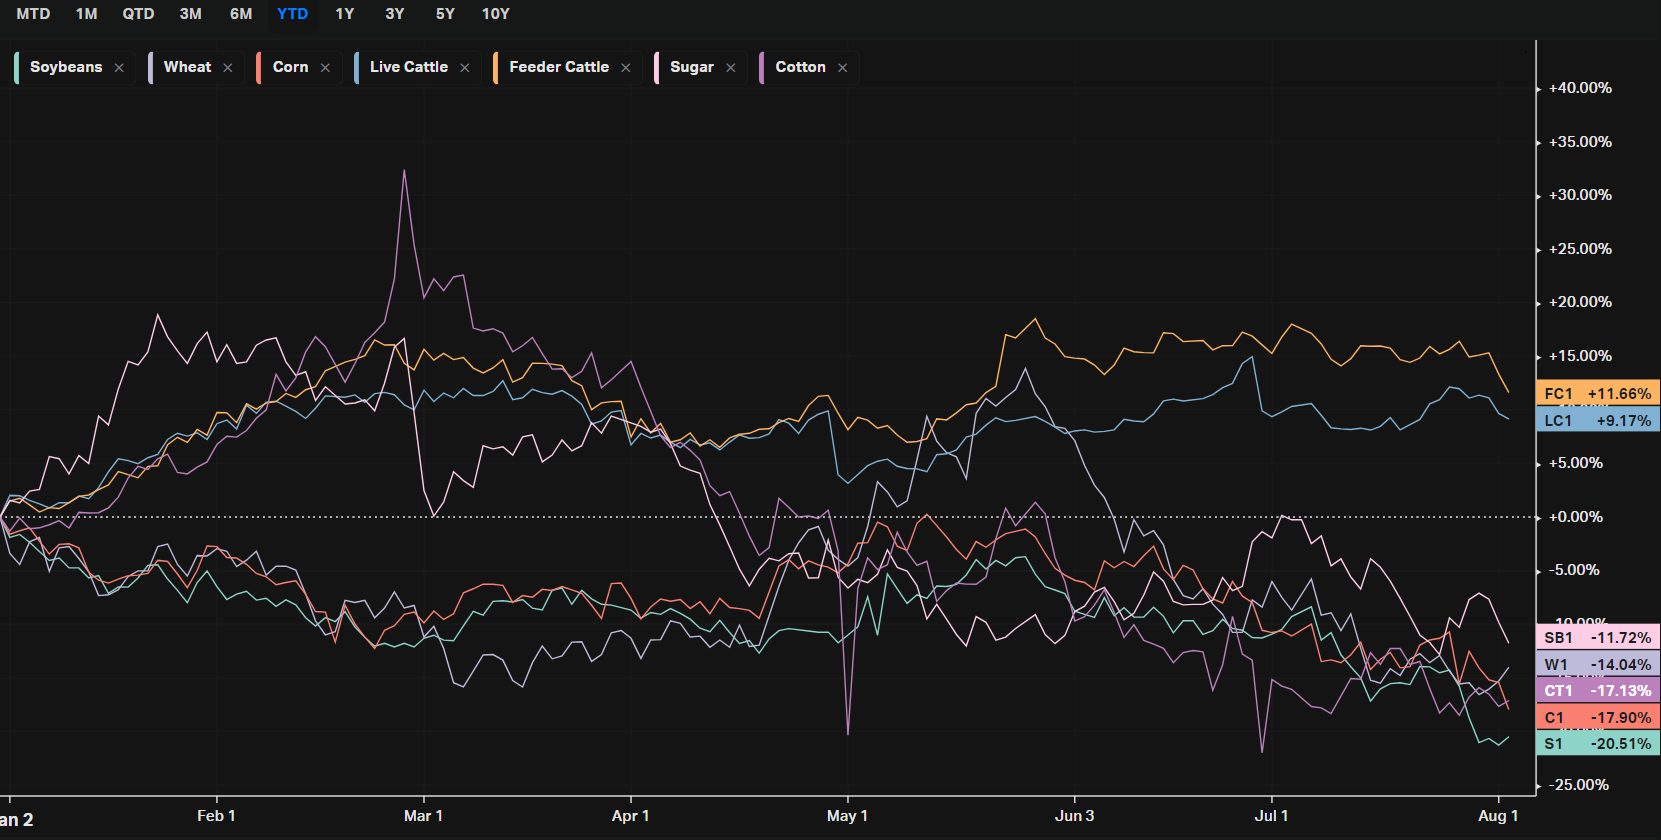
Agriculture
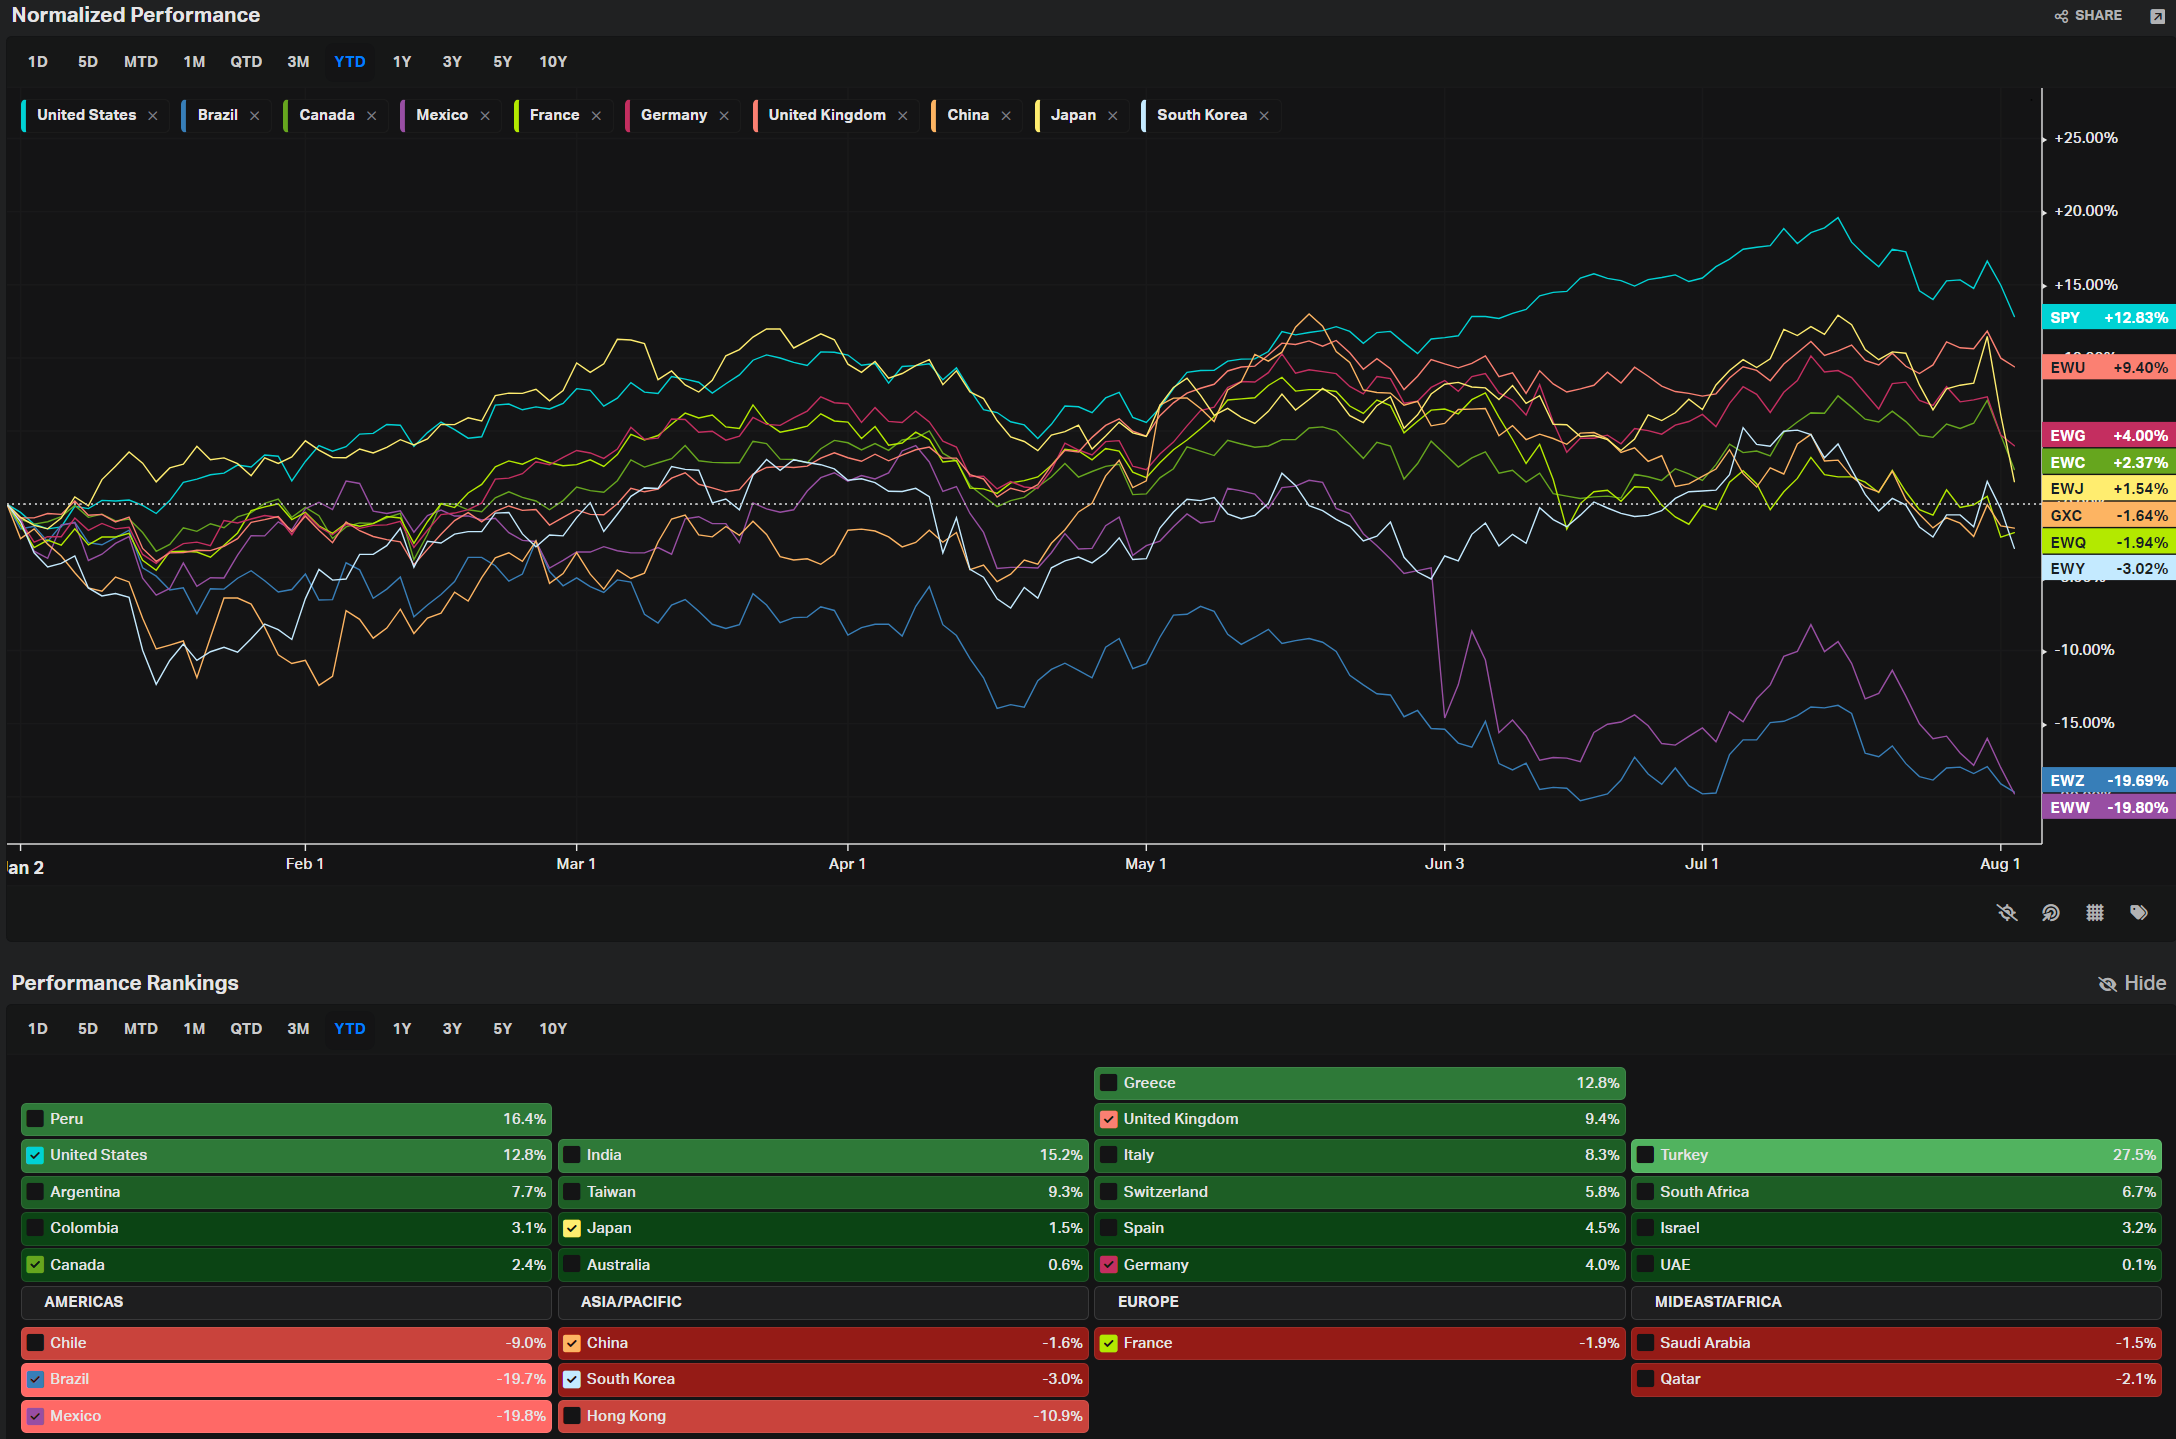
Country ETFs
Yields
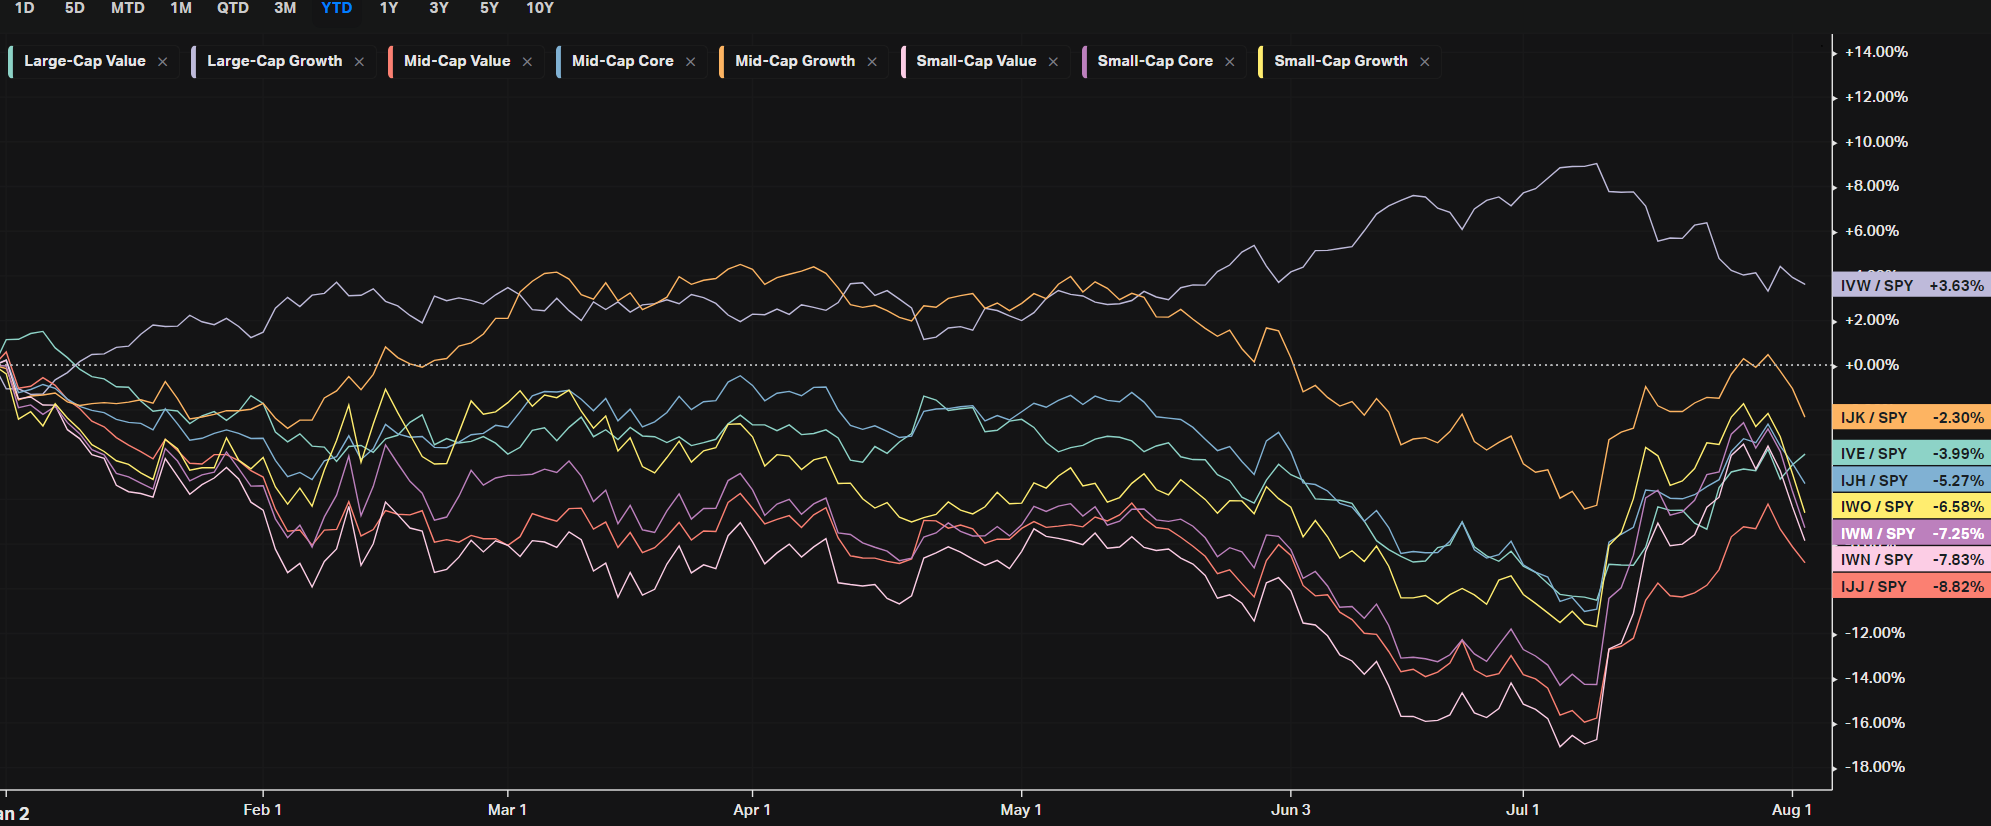
Factors: Size vs Value
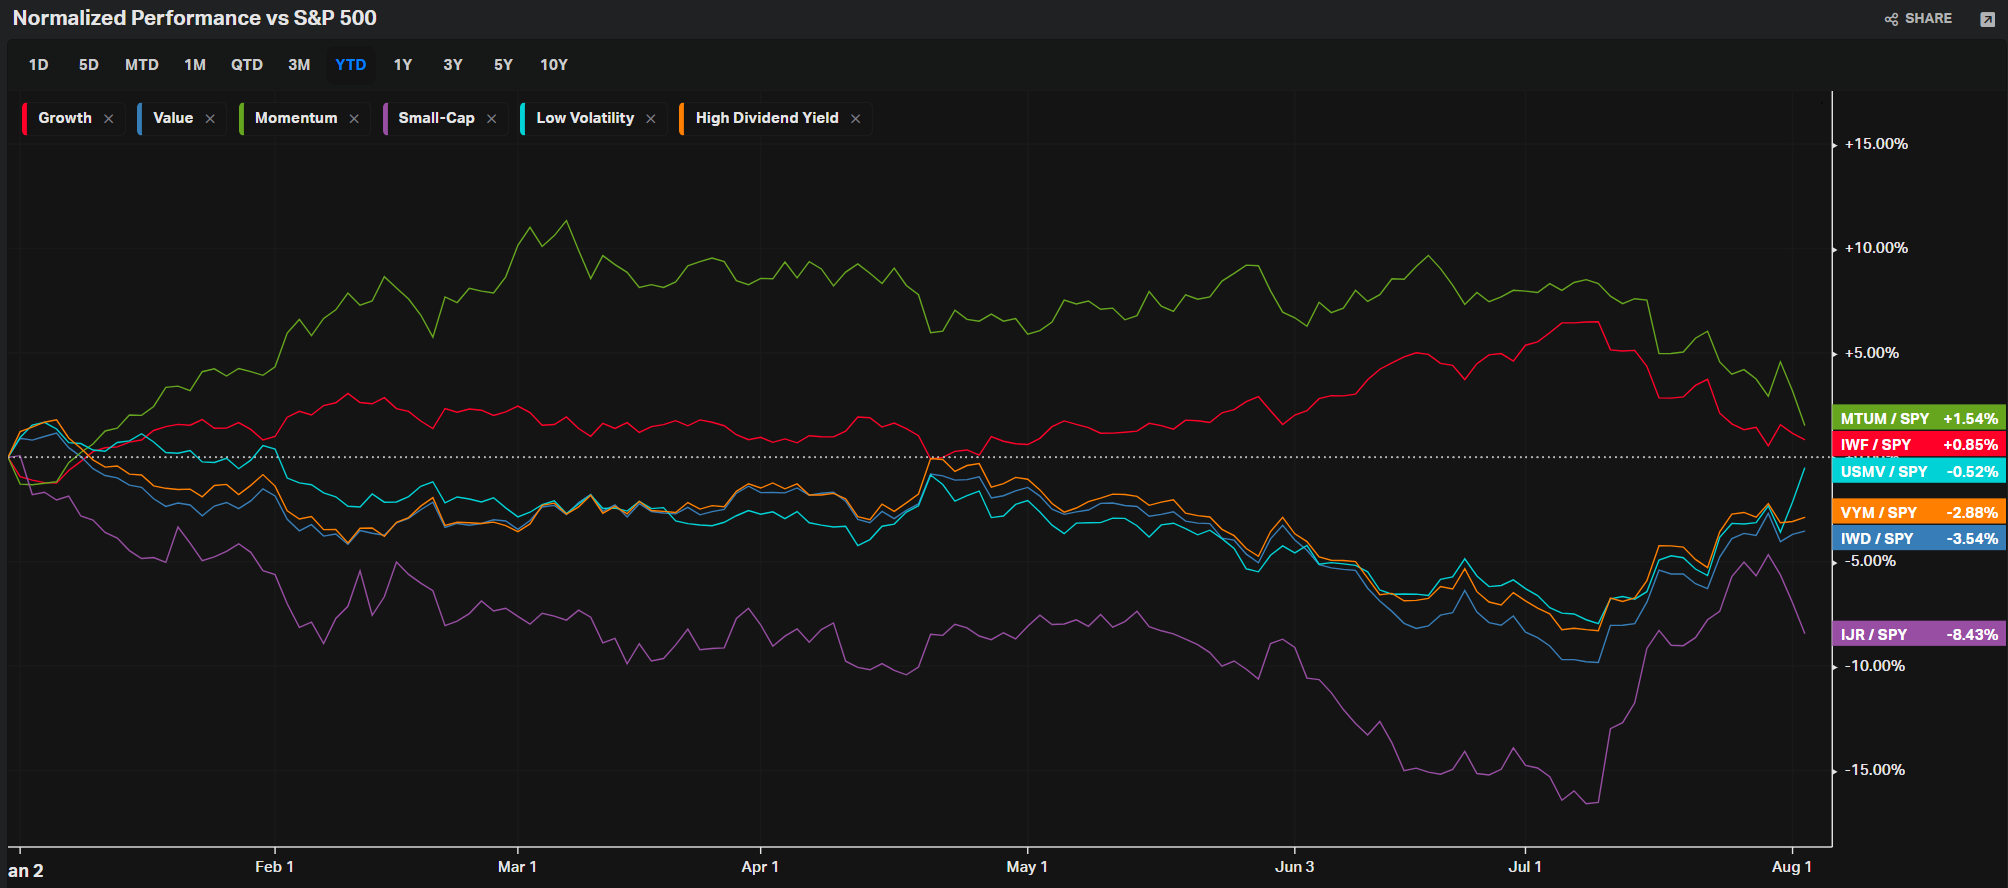
Factors: Style
Events On Deck This Week
Here are key events happening this week that have the potential to cause outsized moves in the market or heightened short-term volatility.
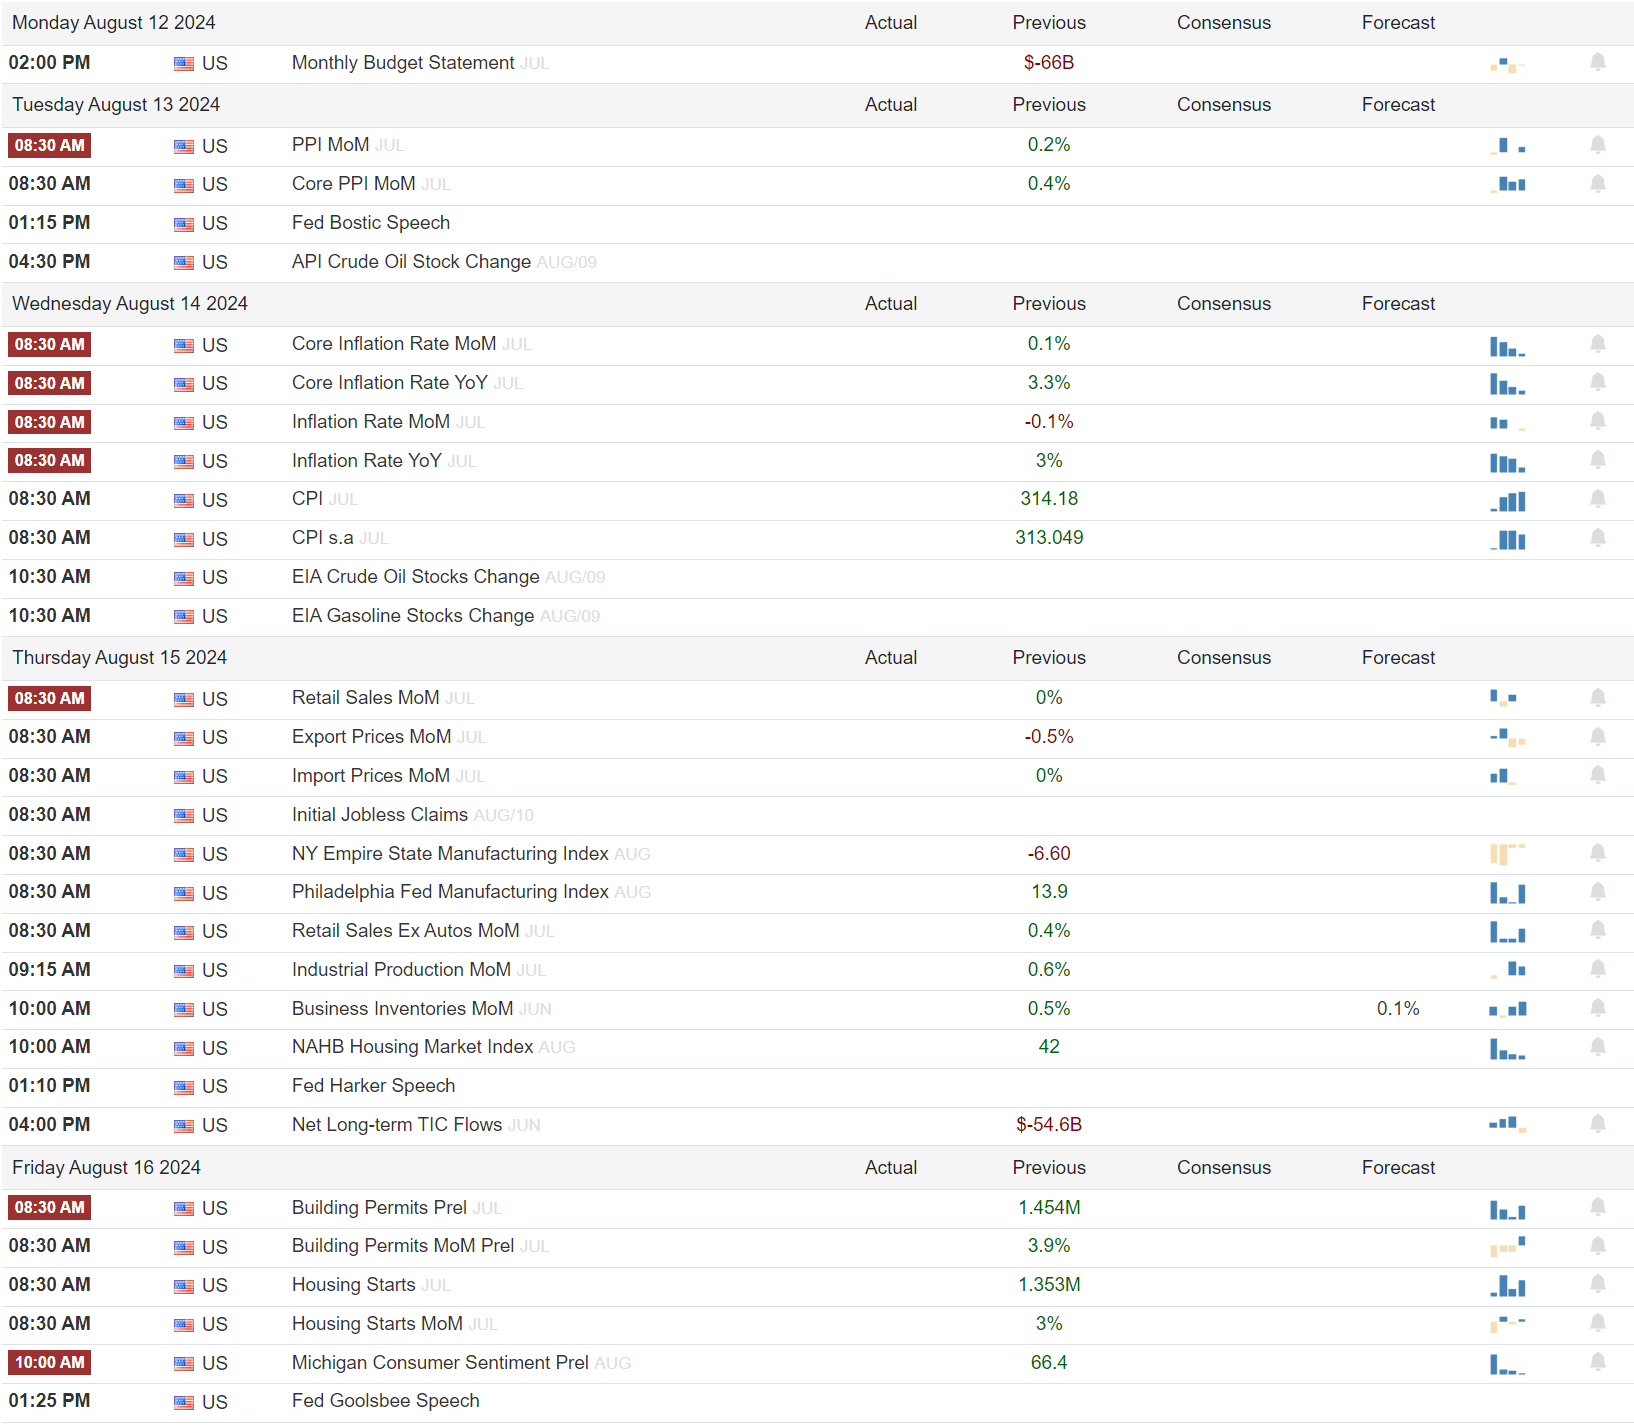
Econ
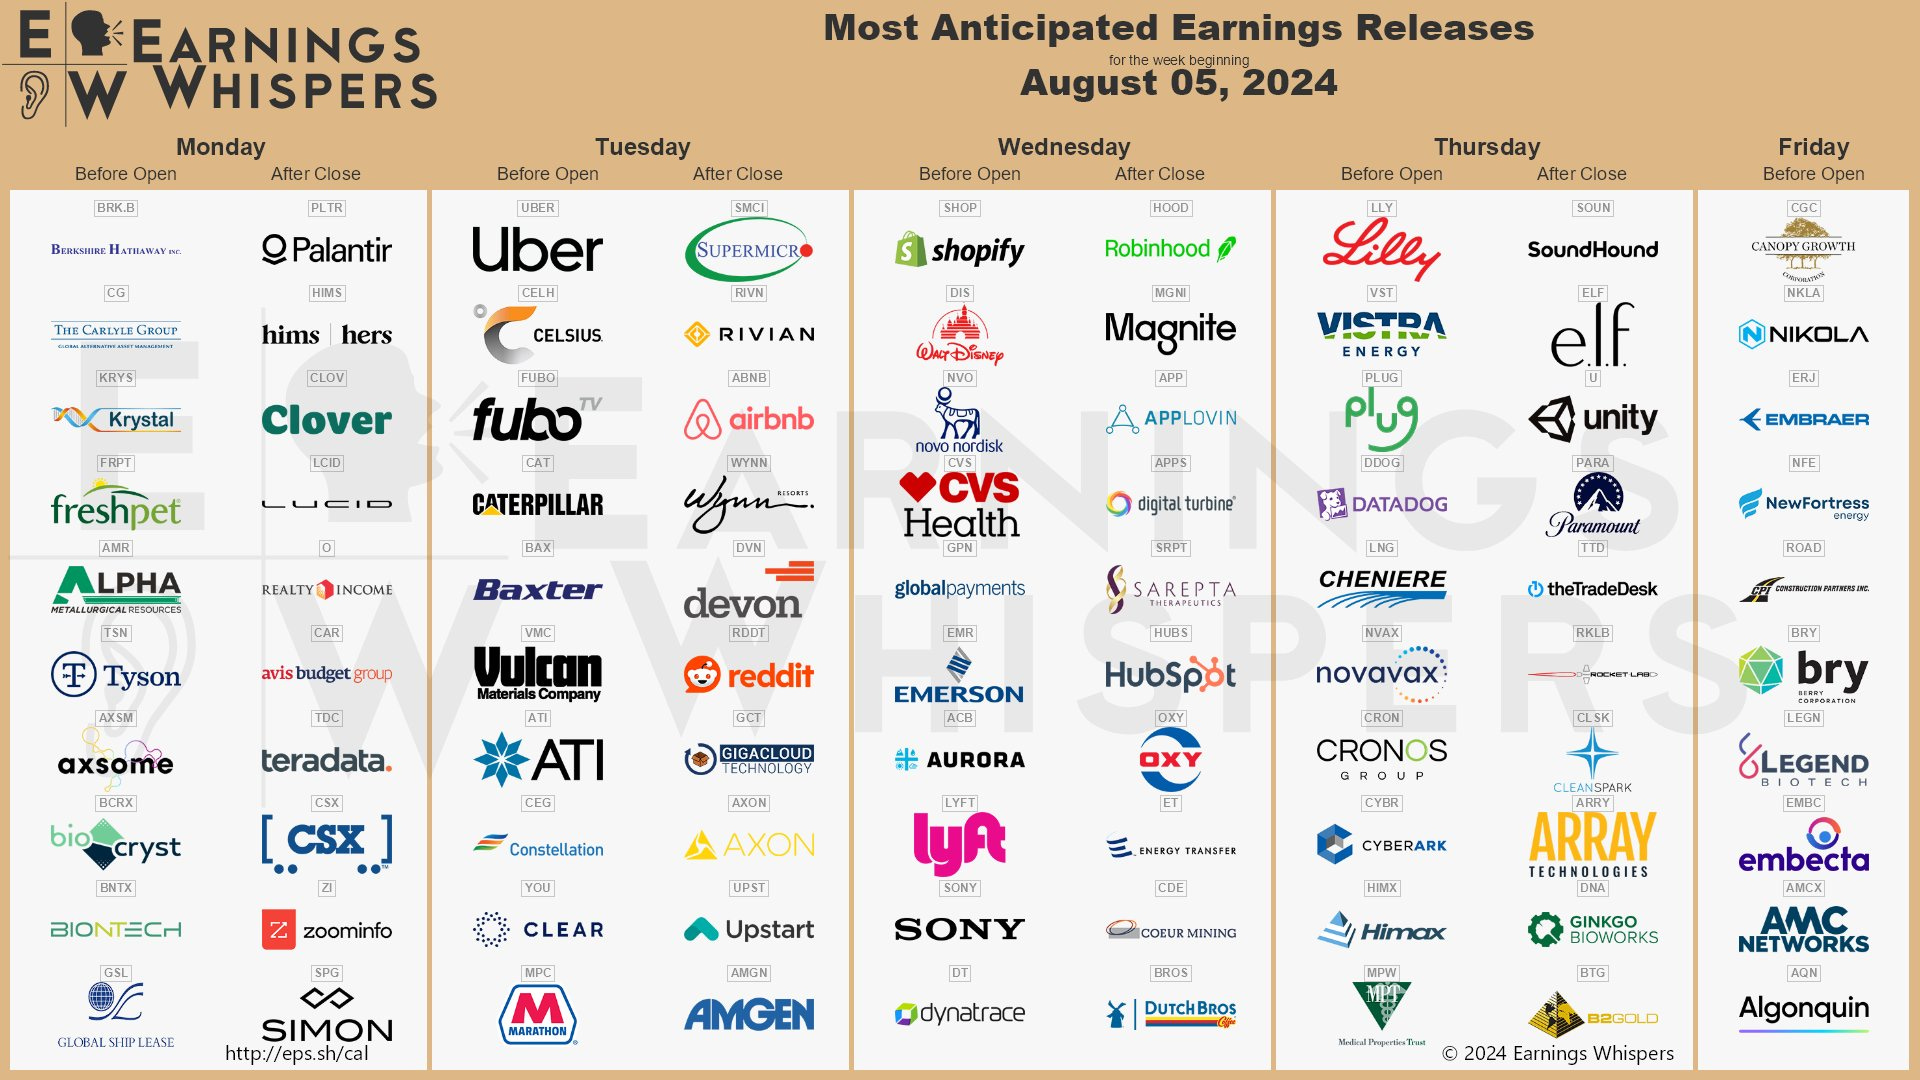
Earnings
A Final Word
Thank you for reading this week's edition of Market Momentum. If you found value in this content, please consider sharing it with a friend or colleague, in a Discord or a Tweet. This small favor helps keep this stack free for you! Please checkout VolumeLeaders.com for your own free trial of the platform that brings you the data powering this stack. Wishing you all a green week ahead filled with many bags.
This article is from an unpaid external contributor. It does not represent Benzinga's reporting and has not been edited for content or accuracy.
Edge Rankings
Price Trend
© 2025 Benzinga.com. Benzinga does not provide investment advice. All rights reserved.
Trade confidently with insights and alerts from analyst ratings, free reports and breaking news that affects the stocks you care about.

