

Last week Nvidia released its quarterly earnings to much fanfare (including this Nvidia earnings watch party in NYC). However, despite beating Wall Street’s expectations yet again, the stock declined as much as 5% in after-hours trading.
For some context, Nvidia became the 2nd most valuable company in the world (at ~$3 trillion) because of the AI revolution. Following the release of ChatGPT in November 2022, the demand for AI/LLMs (large language models) exploded. This meant more data centers and more computing power.
The backbone of all of this additional compute comes from GPUs (graphical processing units). That’s what Nvidia produces and it produces them better than anyone else. As a result, the demand for their GPUs went through the roof.
Today, many of the largest tech companies are spending a sizable portion of their total capital expenditures on Nvidia’s GPUs. For example, Microsoft spends nearly 40 percent of their total capital expenditures on Nvidia, up from less than 10% about a year ago. You can see just how much money many of the tech giants are sending to Nvidia in this chart from Yahoo Finance:

This explains why Nvidia has 80% to 95% market share in AI computing.
But it’s not just their total market share that matters, but their growth. As this chart from Yahoo Finance illustrates, Nvidia’s data center revenue is up 6x over the prior five quarters:

When you combine this incredible growth in revenue with their near monopoly on GPUs, you get a stock that is up 150% YTD.
But as impressive as Nvidia’s growth has been, I’m here to tell you that its valuation is out of control.
To provide some context for this statement, let’s look at the Price-to-Sales (P/S) ratio of Nvidia today compared with Microsoft’s P/S ratio during the DotCom bubble. I’ve aligned these two measures such that the peak of each P/S ratio occurs at the same time (i.e. at the 2,500th trading day) in the chart below:

Nvidia is trading at a higher P/S multiple today than Microsoft was during the peak of the DotCom bubble!
And do you know what happened to Microsoft after its P/S ratio peaked? Its stock got cut in half and didn’t fully recover for 14.5 years.
From January 2000 to July 2014, Microsoft returned 0% while the S&P 500 went up 77% on a total return basis:

Of course, I am not implying that the same exact thing will happen to Nvidia, but you can see why it’s concerning.
I generally don’t like relying on valuation metrics, however, the P/S ratio is one I monitor in the extremes. The reason why is because it’s the purest valuation metric out there. You can’t manipulate it with accounting tricks like you can earnings (P/E) or book value (P/B). Outside of outright fraud, sales are difficult to fake. As a result, this metric can be quite reliable during frothy periods.
The last time I wrote about general stock market froth in November 2021 I relied on the P/S ratio. This is what it looked like at the time:
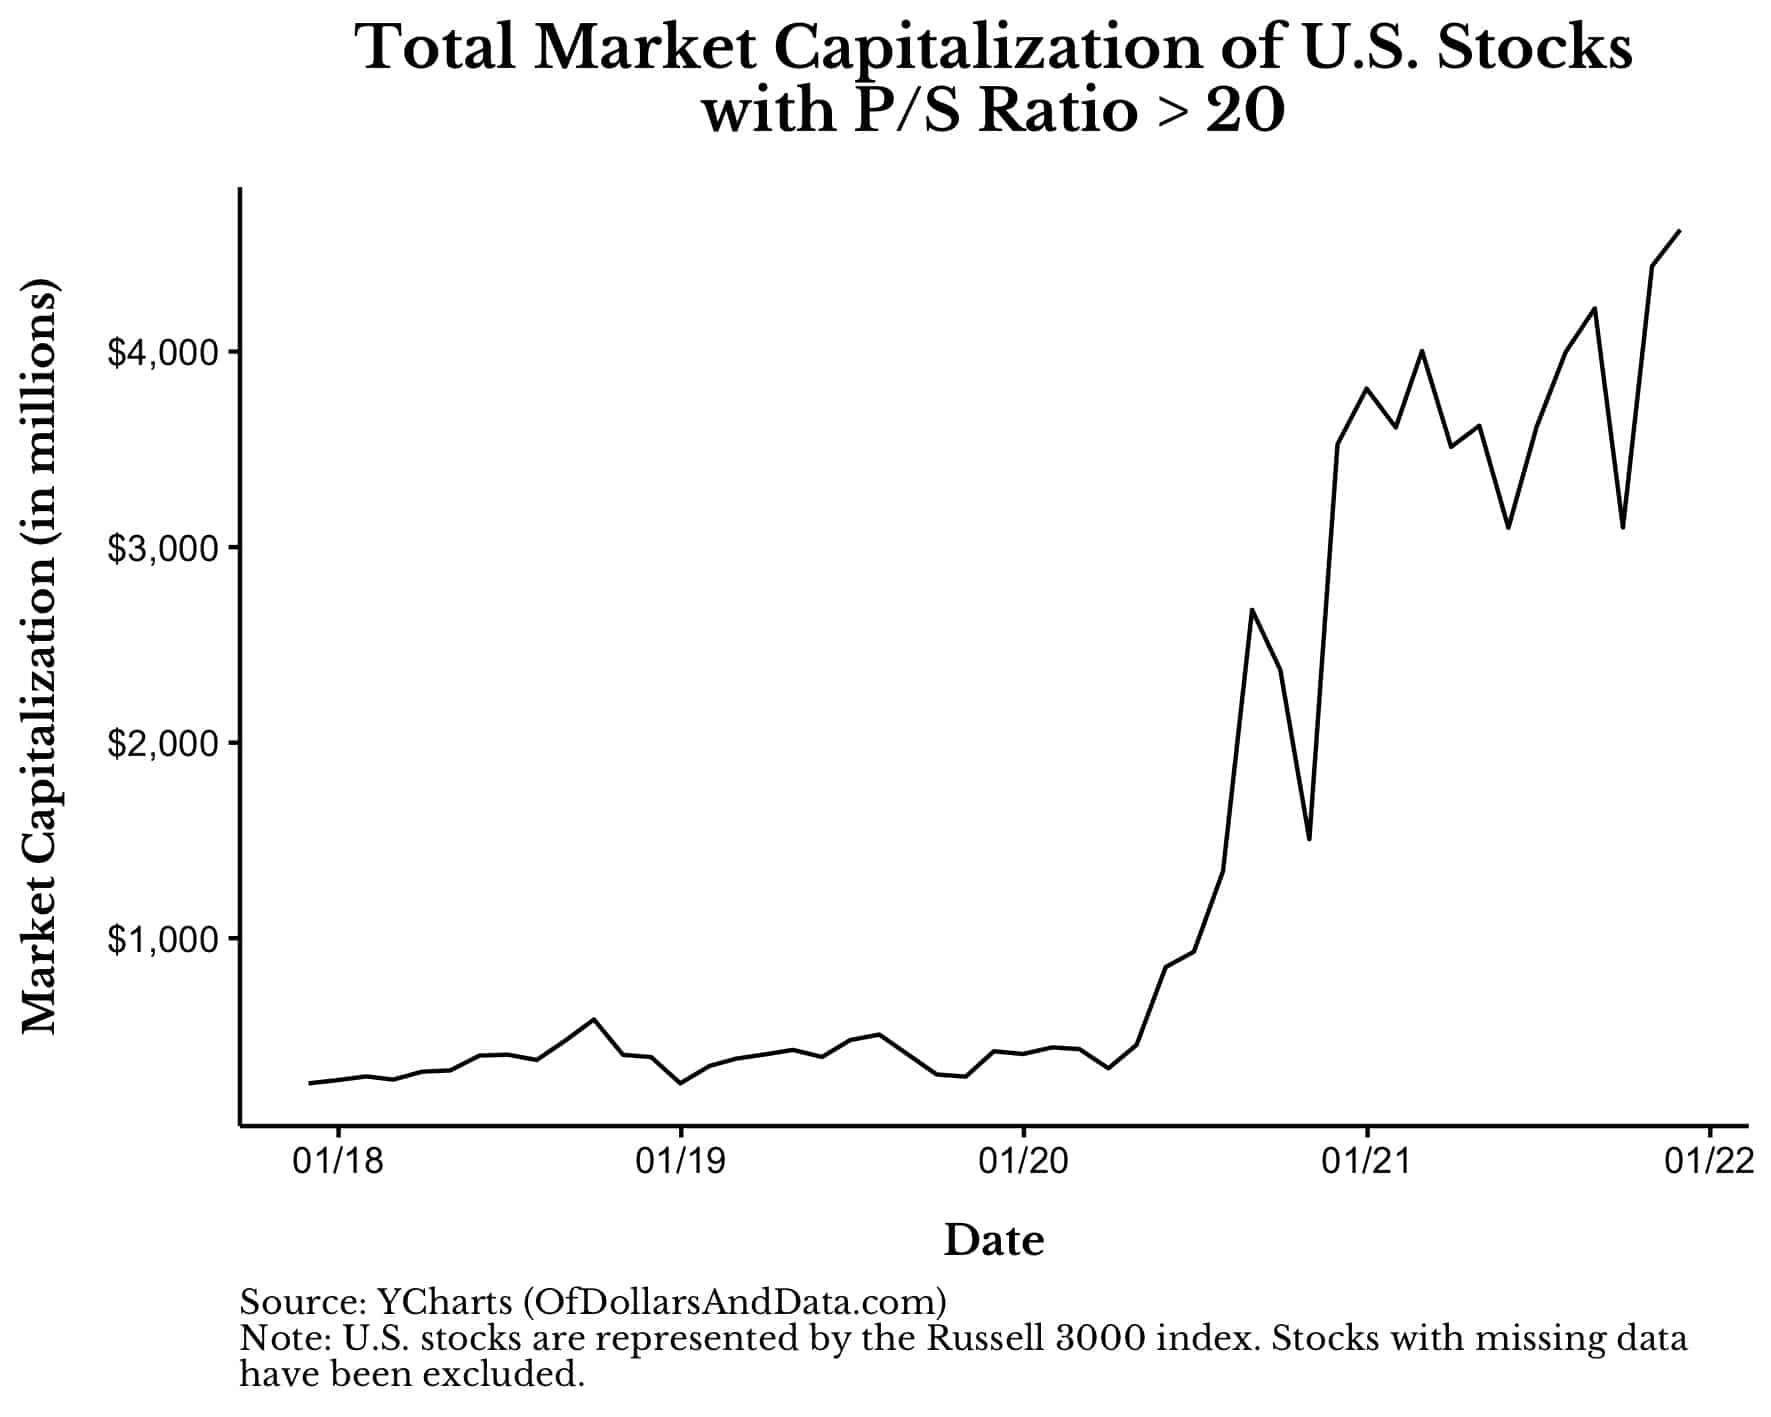
Within a few months of that post, many of these high P/S stocks were crashing. If we were to re-run this chart through today, it would look something like this:

Note that the big spike in early 2022 occurred after I published my “This Will Not Last” warning in November 2021. Even when you know something is off, getting the timing right is incredibly difficult.
Either way, you can see that there are some frothy parallels between now and 2021. It’s not just me who has pointed this out either. Apollo Global Management created this chart illustrating that the 12-month forward P/E ratio of the top 10 companies in the S&P 500 is higher today than it was during the DotCom bubble:

I don’t want to draw too many comparisons to the DotCom bubble because this seems quite different. Though valuations as a whole are slightly elevated, this post isn’t meant to be a “This Will Not Last” Part II. If there is any market frothiness today, that frothiness is incredibly concentrated.
For example, in the chart above showing the market capitalization of companies with a P/S ratio > 20, nearly 66% of that market capitalization today is one company—Nvidia. That wasn’t true in 2021. Yes, there was definitely concentration in the tech sector, but not like this.
So, if you own lots of Nvidia stock, I will say the same thing that I said to Tesla shareholders back in early 2021—just take the money. You’ve won the game. You’ve hit a lotto that you are unlikely to hit again. Take at least some of your gains and diversify. Go on vacation. Enjoy life.
Don’t get me wrong, if you listen to me you are likely to regret it in the coming months. However, I doubt you will regret it in the coming years.
Those Tesla shareholders that heeded my warning on January 12, 2021 and sold their shares would’ve missed out on a 45% gain through November 2021. However, those same investors also wouldn’t be down 27% on their Tesla shares through today either.
Anyone who rotated out of Tesla and into the S&P 500 on January 12 2021, would be up 55% instead:

Of course, maybe this time is different. Maybe Nvidia’s near monopoly won’t be challenged by regulators. Maybe the efforts of competitors to develop their own chips will all fail. Maybe the tech giants will be happy to keep sending 10%+ of their capital expenditures to Nvidia indefinitely. But, I doubt it.
Not only does Nvidia have to deal with its own challenges from competitors and regulators, but with the shortcomings of AI itself. Yes, the AI/LLM revolution is real, but there’s still a lot to be desired. It reminds me of this quote I read from an anonymous Twitter user about AI:
“if my dog could summarize the newspaper to me every morning but got 20% of the stories wrong i would be fascinated by the dog but would still read the newspaper the normal way.”
For the record, I am a big fan of LLMs. I wouldn’t have been able to build my S&P 500 historical return calculator without them. However, like any technology, they have serious limitations. Just consider this simple example (and why it happens):

That’s going to take over the world?
In all seriousness, I bring up the flaws with AI because of how they might affect Nvidia downstream. If the demand for AI declines, so will the demand for Nvidia’s GPUs. While this seems unlikely right now, the future is always uncertain.
With that being said, I don’t know what Nvidia’s stock will do over the next month, the next year, or the next decade. I don’t know a lot about AI or GPUs and I don’t claim to. But I do know market history. And the last few times the data told me what it’s telling me now, it didn’t end well for those investors.
Don’t trade maybes for certainties. They’re rarely worth the risk.
Thank you for reading.
If you liked this post, consider signing up for my newsletter.
© 2025 Benzinga.com. Benzinga does not provide investment advice. All rights reserved.
Trade confidently with insights and alerts from analyst ratings, free reports and breaking news that affects the stocks you care about.

